by Andrea Cavaliere
The choice of what to eat often seems simple, and not particularly impactful. Mostly, one thinks simply about what they would like in terms of taste, price, convenience and maybe health. This is a great simplification of a choice that has plenty of ramifications, not only for one's health, but also for that of the planet, since food production constitutes roughly one fourth of the global human emissions of Greenhouse Gases (GHGs).
The lengthy process that brings food from its place of origin to your plate, the life-cycle of a food product, is often complex, and depending on the specific food item, it will require different amounts of various resources. To simplify, we can use three major resources as indicators of the sustainability of food:
- CO2 footprint
- Water usage
- Country usage
In this discussion, the resource usage of each food type will be normalized to 100g of protein, so that nutritionally equivalent quantities are compared. The data comes from a 2018 study by J. Poore and T. Nemecek.
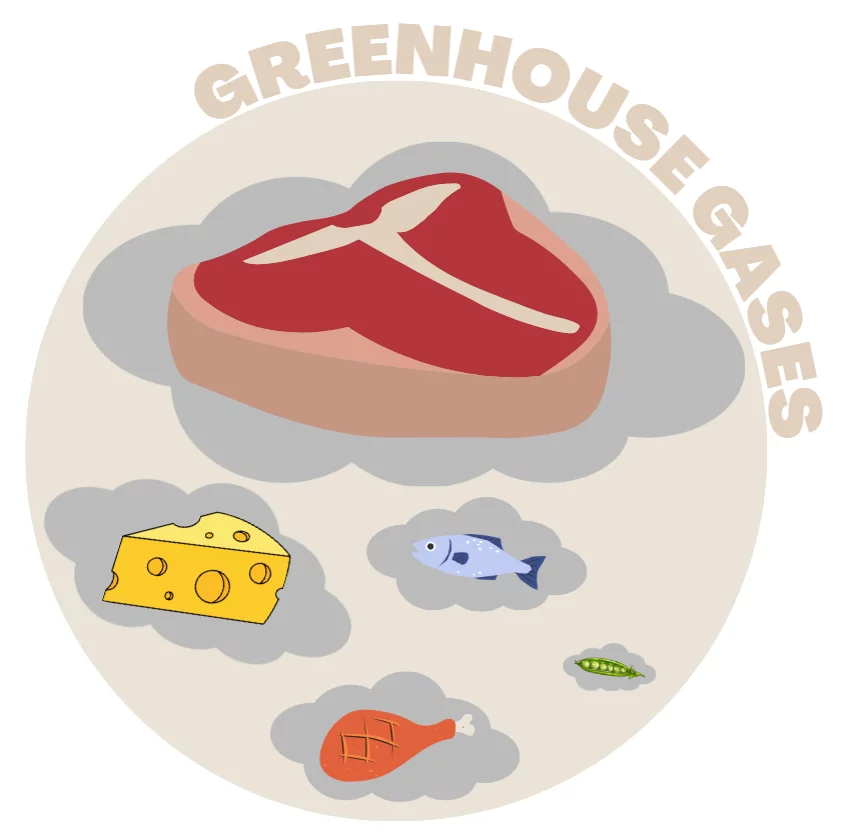
CO2 footprint
This indicator can show us the food we are eating contributes to global warming. This is commonly measured by calculating how many kilograms of CO2 are necessary to produce the same effect as all the GHGs released in the production, transportation and disposal processes. This value goes higher the more energy intensive food production is, or if the food has to travel long distances on the road, or, in some cases, when powerful GHGs are released. For example, cattle and other ruminants are known to emit plenty of methane during their lifecycle, which constitutes a significant amount of their environmental impact; rice paddies also emit methane, due to the methane-emitting bacteria that generates there during flooding.
The average CO2 footprint for several food items is displayed below, from worst to best, expressed in kg of CO2 equivalent per 100g of protein:
- Beef - 99.5 (beef herd) or 33.3 (dairy herd)
- Lamb and mutton - 39.7
- Cheese - 23.9
- Fish (farmed) - 13.6
- Pig meat - 12.3
- Chicken - 9.9
- Eggs - 4.7
- Tofu - 3.2
- Legumes - 1.8
- Nuts - 0.4
It is not surprising that animal products rank so poorly. Animals require feed and more resources to be cared for and processed into meat. Ruminants, in particular, appear at the top of the list because they release a lot of methane during the digestion process. Of course, while the average value is displayed here, every production site has its own footprint. Fewer emissions are associated with beef coming from the Swiss alpine pastures when compared to countries where pastures are created with repeated deforestation. On the other hand, it is worth noticing that the best beef, lamb and cheese still have more emissions than the worst tofu, legumes or nuts.
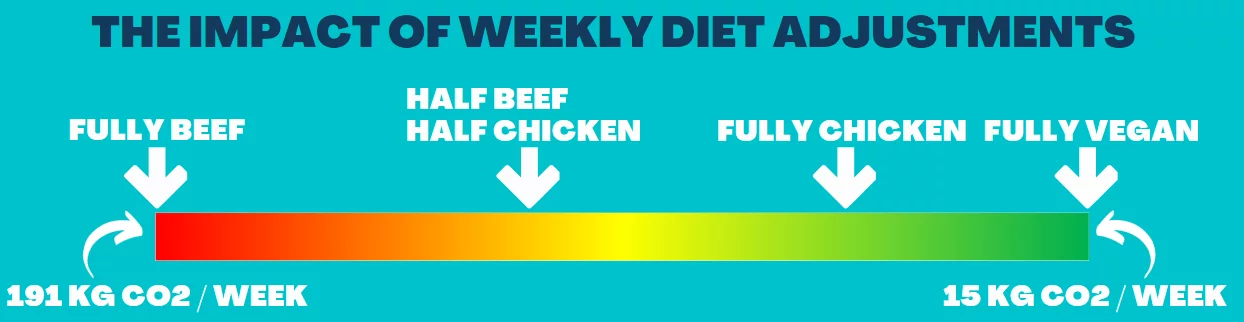
It is not crucial to stop eating meat altogether. A balanced diet can have positive effects on the planet and on one's health, and by eating a variety of foods, one can significantly reduce the carbon footprint of their eating habits. Reducing the quantity of beef and replacing it with less polluting options can greatly reduce one's footprint. The image above shows the spectrum of footprints between eating five beef-based lunches (with sides) and five vegetable-based lunches (also with sides).
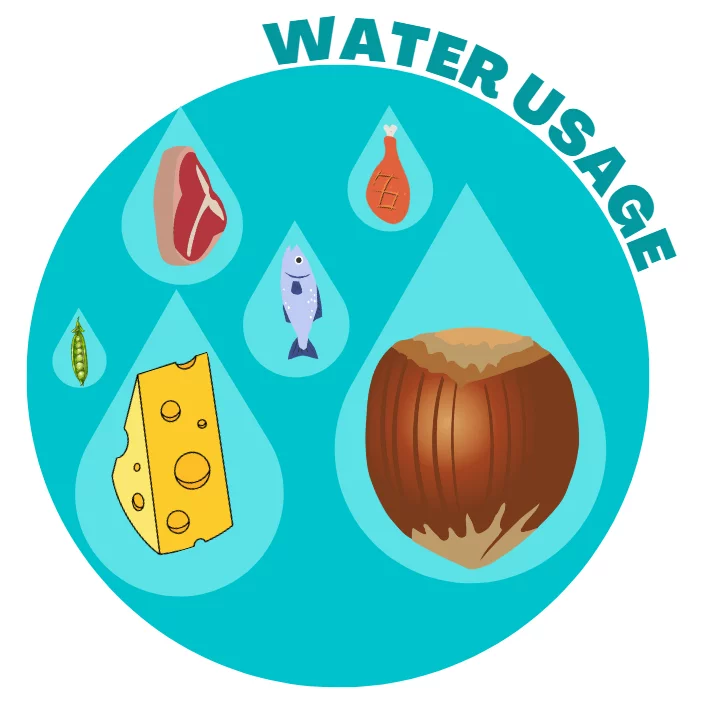
Scarce water usage
This indicator covers the effects of food production on freshwater resources, considering both the amount of water used for the process and its contamination. These effects impact mainly the neighborhood of the production site, but water scarcity is a reality that is growing in scope and intensity due to climate change, with poorer communities in the frontline against their consequences. It is very important to relativize water usage to the availability of freshwater resources in the region to get a fair comparison of how the local communities are impacted; thus, the Stress-Weighted Water Use is used to indicate this. The average Stress-Weighted Water Use for several food items is displayed below, from worst to best, expressed in liters of water per 100g of protein:
- Nuts - 140,778
- Cheese - 81,907
- Lamb and mutton - 70,927
- Beef - 17'419 (beef herd) or 60'692 (dairy herd)
- Pig meat - 41'327
- Fish (farmed) - 18'229
- Eggs - 16'206
- Legumes - 10'499
- Chicken - 8'186
- Tofu - 3'196
Nuts dominate this list by a wide margin. One reason is that nut trees need several years of growth to produce nuts for sale, but a much more important one is that most of the production for nuts happens in arid regions, which would be affected much more strongly but the use of water. This also means that most water comes from irrigation rather than rainwater, exacerbating the problem. It is no surprise that this indicator for nuts ranges from highs of 494'586 down to lows of 0, when rainwater is completely sufficient.
Animal products (with the notable exception of chicken) tend to also require plenty of freshwater, although much less than nuts. This comes from the need to care for the animals for extended periods of times, and from the need to water the crops that will be animal feed. The longer lifespan of dairy herds also leads to cheese and beef using more water.
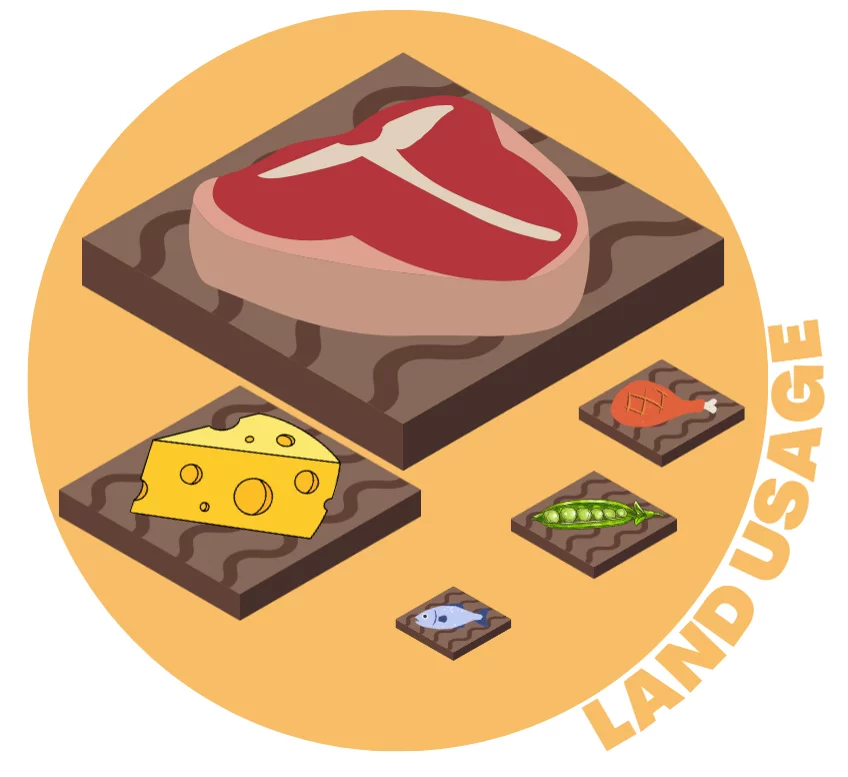
Land usage
This indicator refers to the amount of land required to produce a set amount of food per year. It is important to note that of all habitable land, more than half is currently employed in agriculture. Of this, almost 80% is dedicated to animal grazing grounds or fields to produce feed for them. This large amount is also growing, as the vast majority of deforestation is intended to create more pastures. The average land use for several food items is displayed below, from worst to best, expressed in m2 per 100g of protein:
- Lamb and mutton - 185
- Beef - 164 (beef herd) or 22 (dairy herd)
- Cheese - 40
- Pig meat - 11
- Nuts - 7.9
- Legumes - 7.3
- Chicken - 7.1
- Eggs - 5.7
- Fish (farmed) - 3.7
- Tofu - 2.2
The data shows how ruminants in particular tend to have a very high land use, mostly because of their need to graze on grass. Although some pastures are located on land that is unsuitable for growing crops, such as in the mountains, this constitutes less than 20% of all of the grazing grounds. From this indicator, it can be seen that, aside from the aforementioned ruminants, other food sources do not have a large difference in land use, with fish and tofu (a soy-based cheese-like food) having the best scores in the list.