Plasma and Thin Film Analysis

Combining quadrupole mass selector with kinetic energy selector

Scematic of a quadrupole mass spectrometer with kinetic energy analyzer.

In order to investigate the mass and energy distribution of laser generated plasma species in detail, a quadrupole mass spectrometer with a kinetic energy analyzer is available (Hiden Analytical Inc.). This set up allows the direct measurement of the kinetic energy distributions of positive, negative and neutral plasma species up to 1 keV.

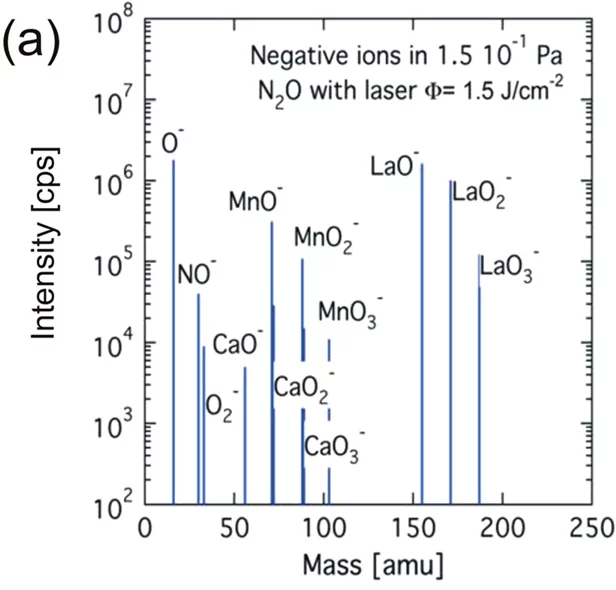
The mass spectroscopy setup enables a better understanding of the species composition (left figure) and their respective energy distribution in the plasma (right figure). Information about the detected positive, negative and neutral species in the laser induced plasma can also be obtained. However, for neutral species only a qualitative analysis is possible to to the unkonwn ionisation cross sections of the arriving species.
 

Mass spectrum of negative ions for a La0.4Ca0.6MnO3 ablation plasma using a 193nm ArF laser at a N2O pressure of 1.5x10⁻¹ Pa and a fluence of 1.5J/cm2.

Kinetic energy distributions for LaO+ in vacuum, O2, and N2O.

Target: La0.4Ca0.6MnO3 ArF excimer laser (λ=193nm, ν=5Hz), Φ=1.5J/cm2
Target to detector distance: 4cm

For more details, see Appl. Phys. Lett. 99, 191501 (2011)

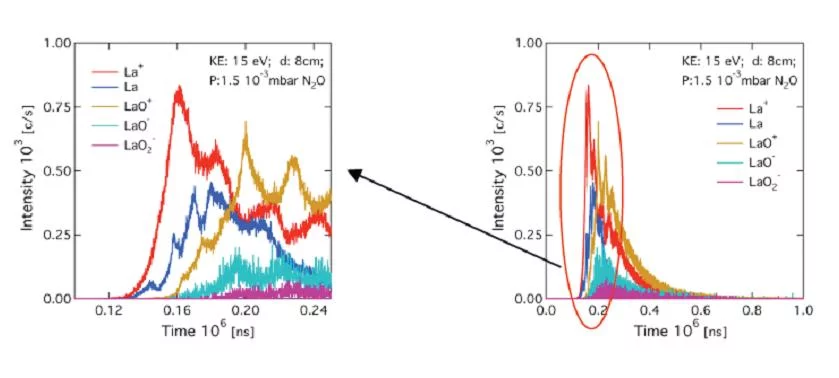
Combining the mass spectrometer with a Multichannel Scaler system, the arrival time of plasma species with a defined mass and selected kinetic energies can be measured.

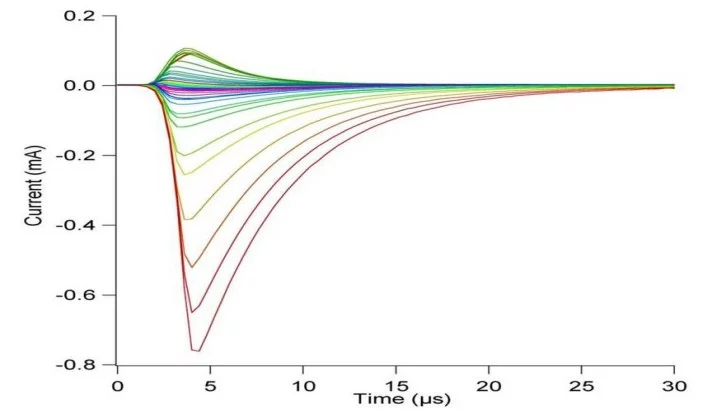
TOA curve of 355 nm laser induced Ag plasma under different probe bias voltage.
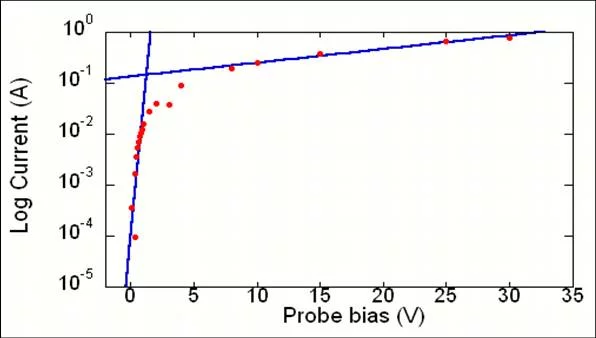
Electron temperature (Te) can be deduced from the retarding region of the semi-logarithmic I-V curve.
A Langmuir probe is one of the most simple and direct approaches to monitor the laser induced plasma by measuring the ion current. It works by inserting a metal probe with variable bias voltage into the plasma. The time of arrival signal of the charged species in the plasma can be directly obtained at each bias voltage as shown in the left figure. This enables to estimate the speed of the plasma. Besides, through the relationship between the magnitude of applied bias voltage and detected current signal, the temperature of the electrons can be determined.
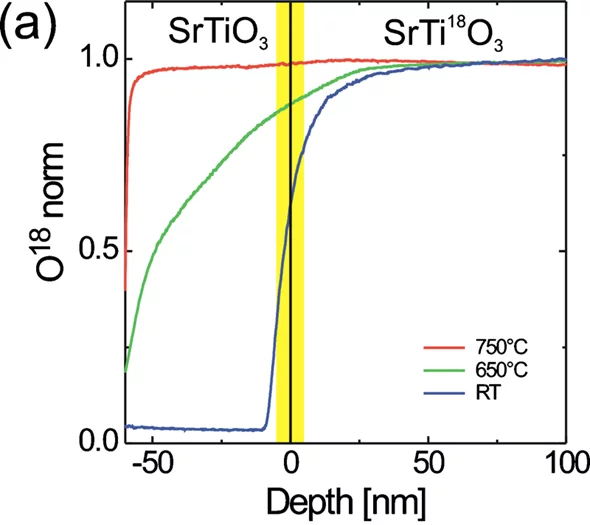
18O SIMS depth profile of SrTiO3 on SrTi18O3 grown at Ts=750°C, 650°C, and room temperature. The sharp drop of the 18O signal near the SrTiO3 surface for the film grown at TS=750°C could be related to a back-exchange of 16O at room temperature.
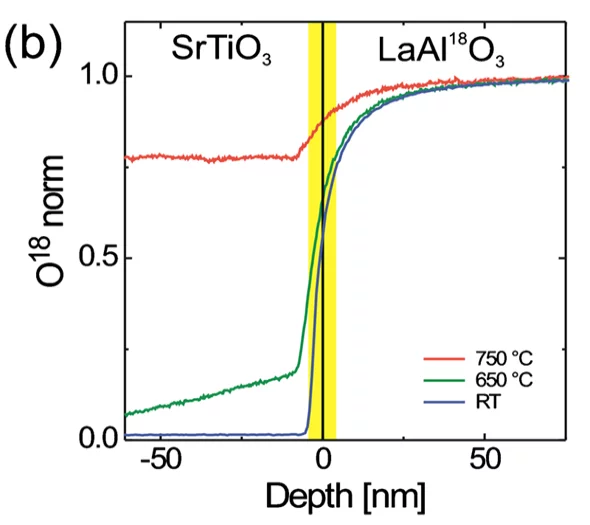
18O SIMS depth profile of SrTiO3 on LaAl18O3 grown at Ts=750°C, 650°C, and room temperature.
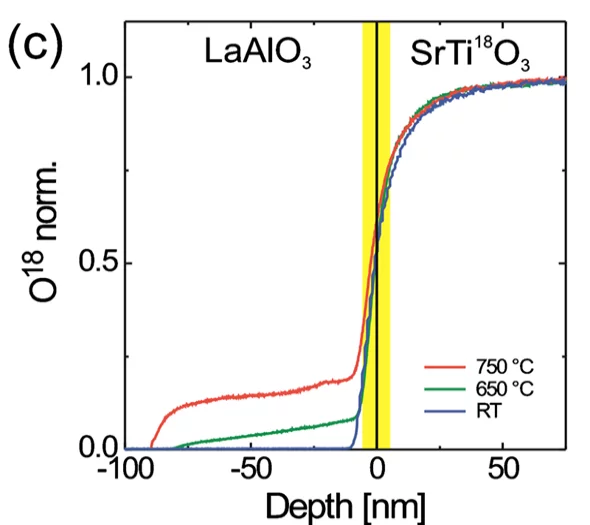
18O SIMS depth profile of LaAlO3 on SrTi18O3 grown at Ts=750°C, 650°C, and room temperature.
Combining the mass spectrometer with an Ion Gun (Hal IG20) and an Electron Flood Gun (PREVAC) enables to profile both the films depth and mapping of elements also from insulating samples. More details can be found in Appl. Phys. Lett. 97, 192107 (2010)

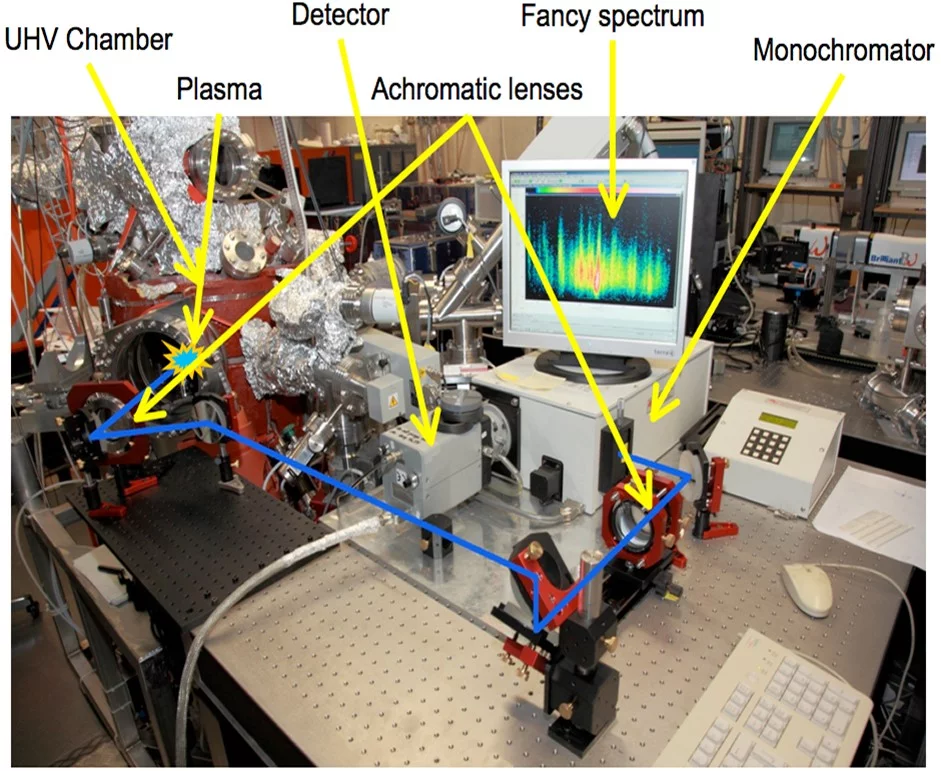
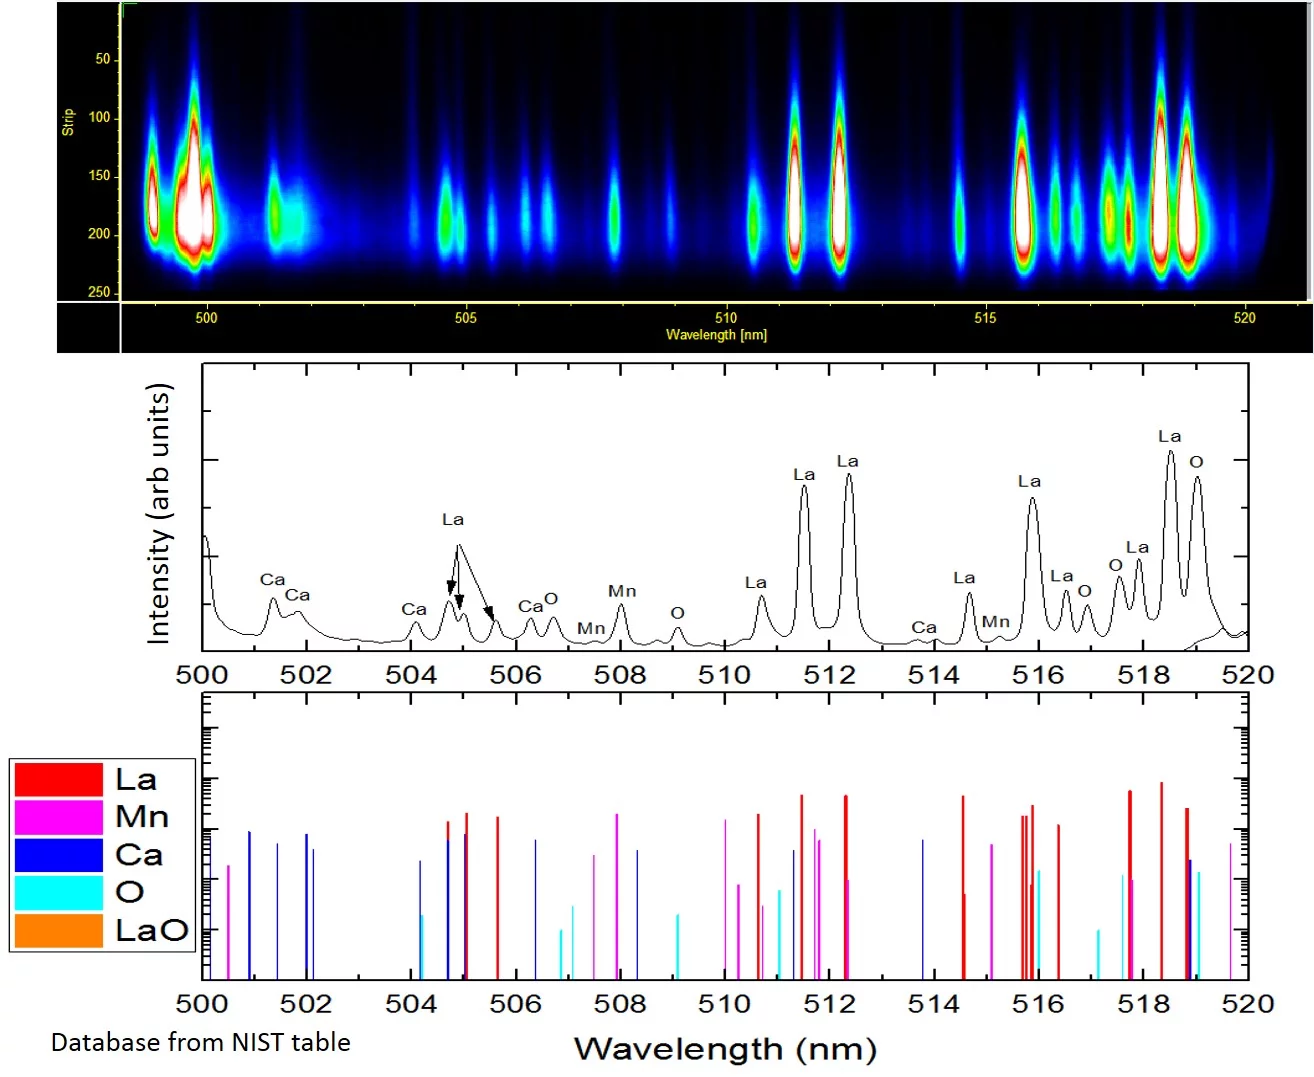
Complementary to mass spectroscopy, we investigate the excited species in the laser induced plasma by emission spectroscopy. The first photo shows the experimental imaging/spectroscopy set-up where an image of the laser induced plasma is projected onto the entrance slid of the monochrometer via the indicated optical beam path. Through the combination of different delay times, we can record a spatially and time resolved emission spectrum of the plasma (top right image). The second image shows a La0.6Ca0.4MnO3 spectrum recorded with the spectrometer set-up between 500 and 520nm. Bottom: excitation lines published in the NIST database for the same wavelenght range.

Experimental set-up to record the optical laser-induced emission spectra.
Spatially, time and frequency resolved spectra of La0.6Ca0.4MnO3 recorded between 500 and 520nm. The measured spectruma are compared to excitation lines published in the NIST database.
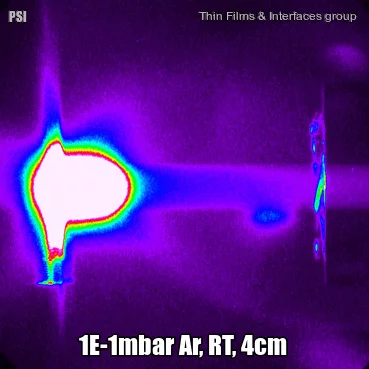
The plasma imaging set-up is shown in the left image. A high speed gated ICCD camera (Andor New i-star) is used to record the time evolution of the ablated material. The images are recorded for either all light admitted through a quartz window (200nm-1000nm) or for selected wavelengths using an Acousto-optic tunable filter (AOTF, 400-1000 nm). The Brimrose models VA210-0.55-1.0-H and VA210-0.40-0.65-H) has a wavelength resolution of 0.6-3 nm with a manufacturer certified resolution of 1.3 nm at 633 nm. An image of an experimental arrangement (cylindrical Ag target with a target-heater/MS distance of 4cm is shown (Fig. (a)), followed by an all light image of the expanding plasma with (b) and without (c) heater. Images by Yao Xiang and Alejandro Ojeda.

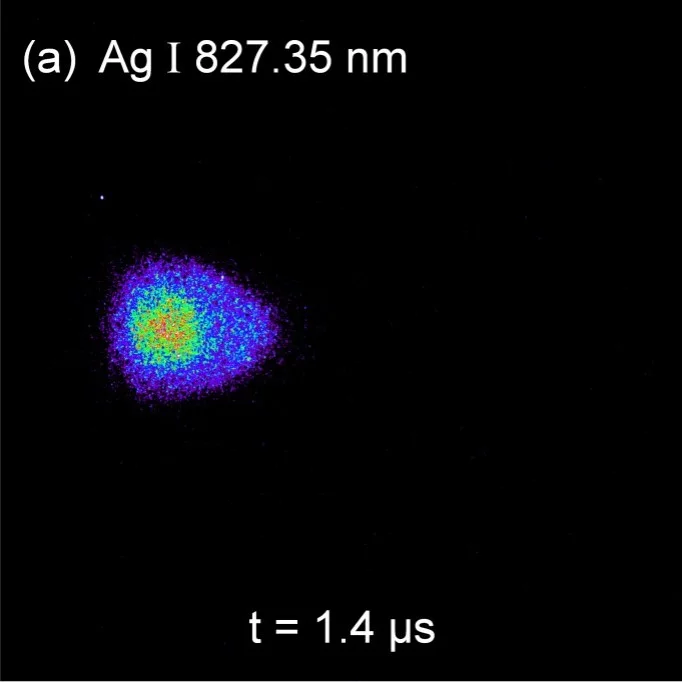
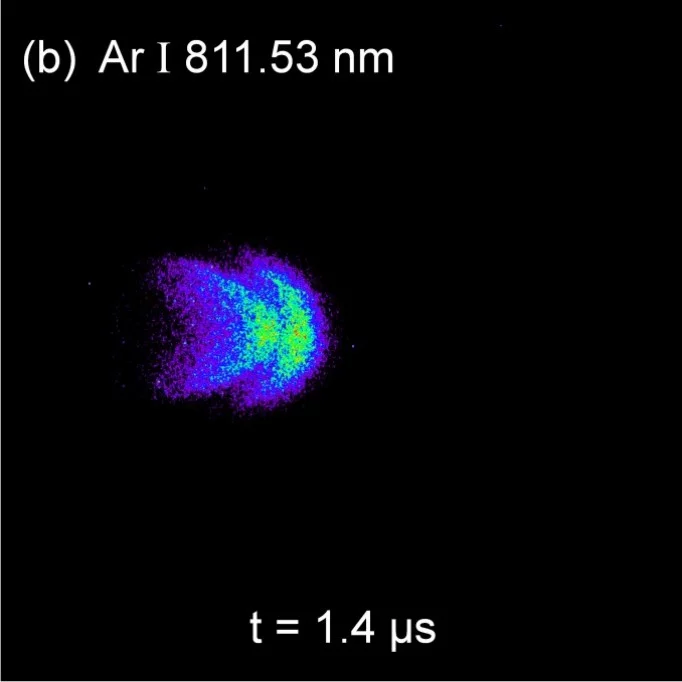
As an example of selected line imaging using an AOTF, the next images show the spatial distributions of Ag and Ar excited neutrals at the same time frame of 1.4µs. The AOTF selected optical excitation lines were 827.35 nm for Ag I and 811.53 nm for Ar I. For each image 100 accumulations were used to increase image resolution. The gradients are normalized to the maximum counts for each image. More details can be found in J. Appl. Phys. 120, 225301 (2016).
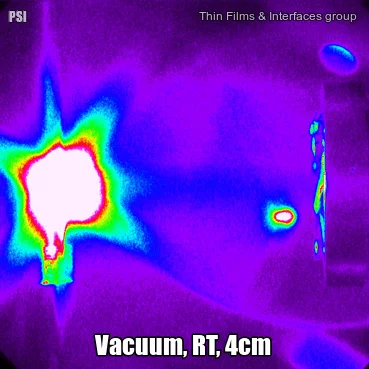
 

In addition to the frequency, time and space resolved spectroscopy, we do time, space and frequency resolved imaging. One example is shown in the following animation where the plasma expansion of silver was recorded between the initial impact of the laser beam on the target and 10µsec after with a time resolution of 500nsec for each frame. After approx. 2µsec a rebound of the impinging Ag species from the heater is observed. These rebounded species travel back even as far as the target.
This video clip shows the rebound of Ag at room temperature and 1x10⁻¹ mbar Ar background pressure. The target-substrate distance is 4cm and the total recorded time approx. 60µsec. More details to the silver ablation and the rebound can be found in A. Ojeda et al, J. Appl. Phys. 120, 225301 (2016).

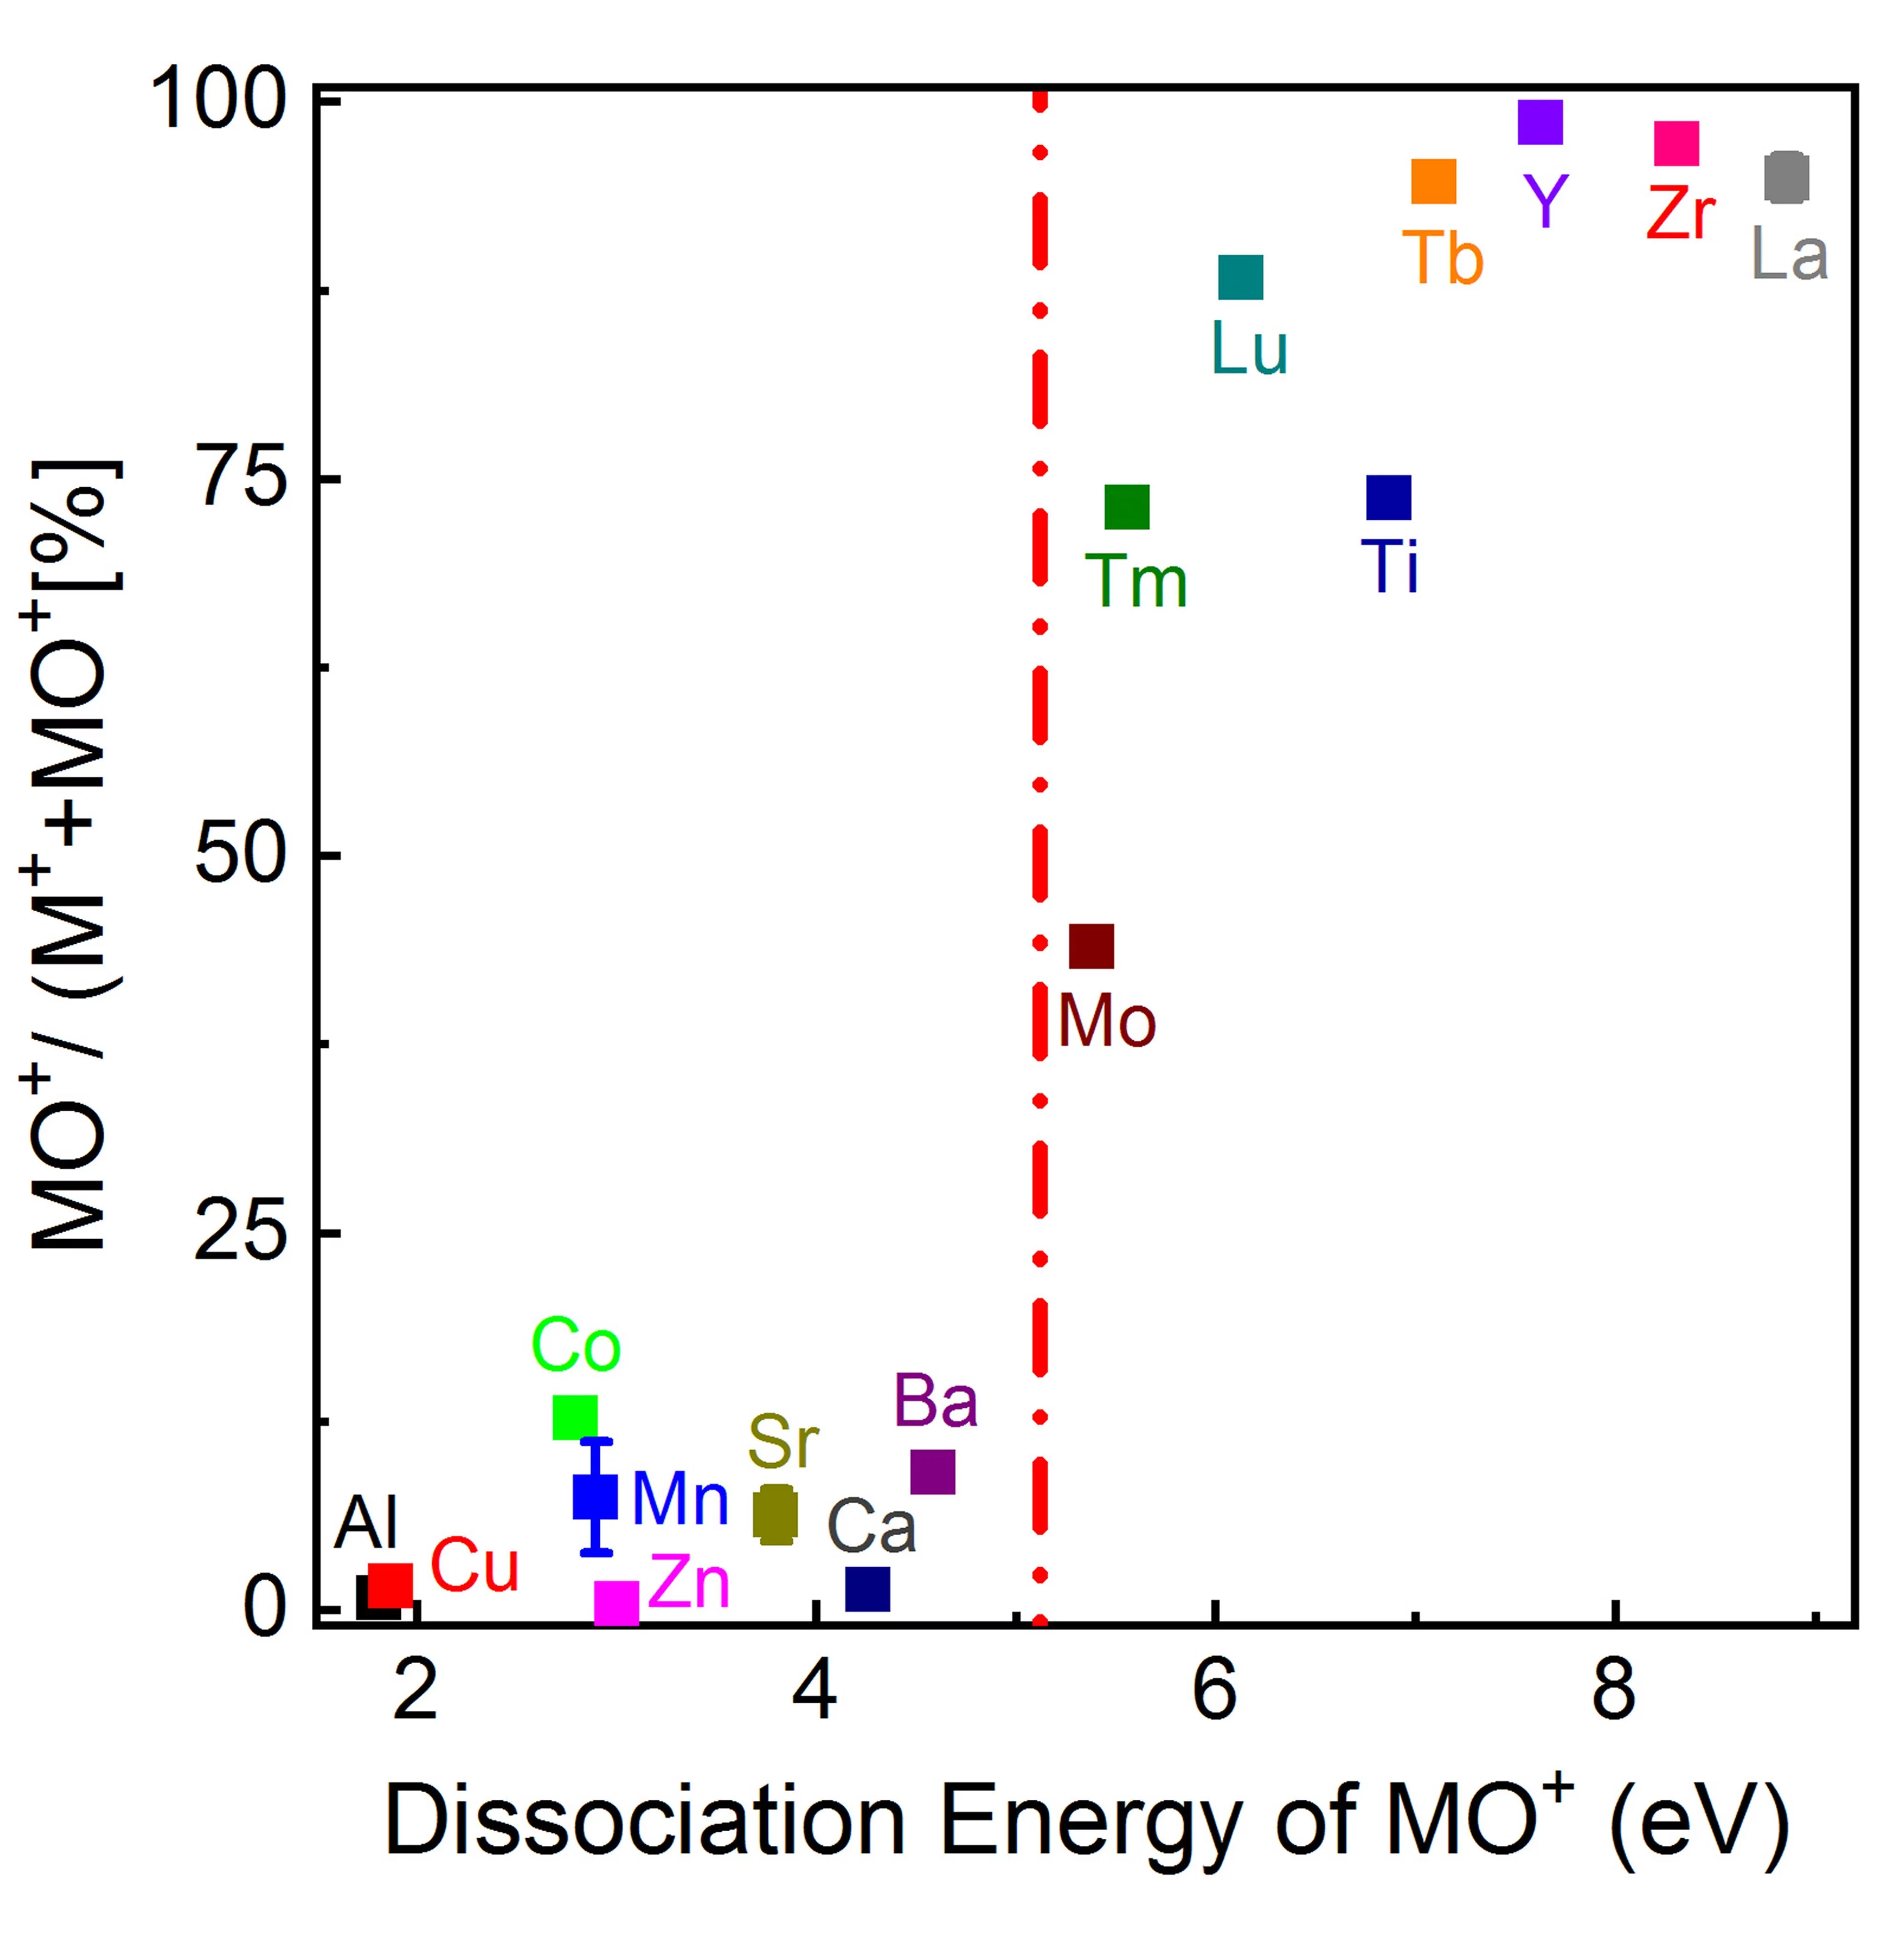
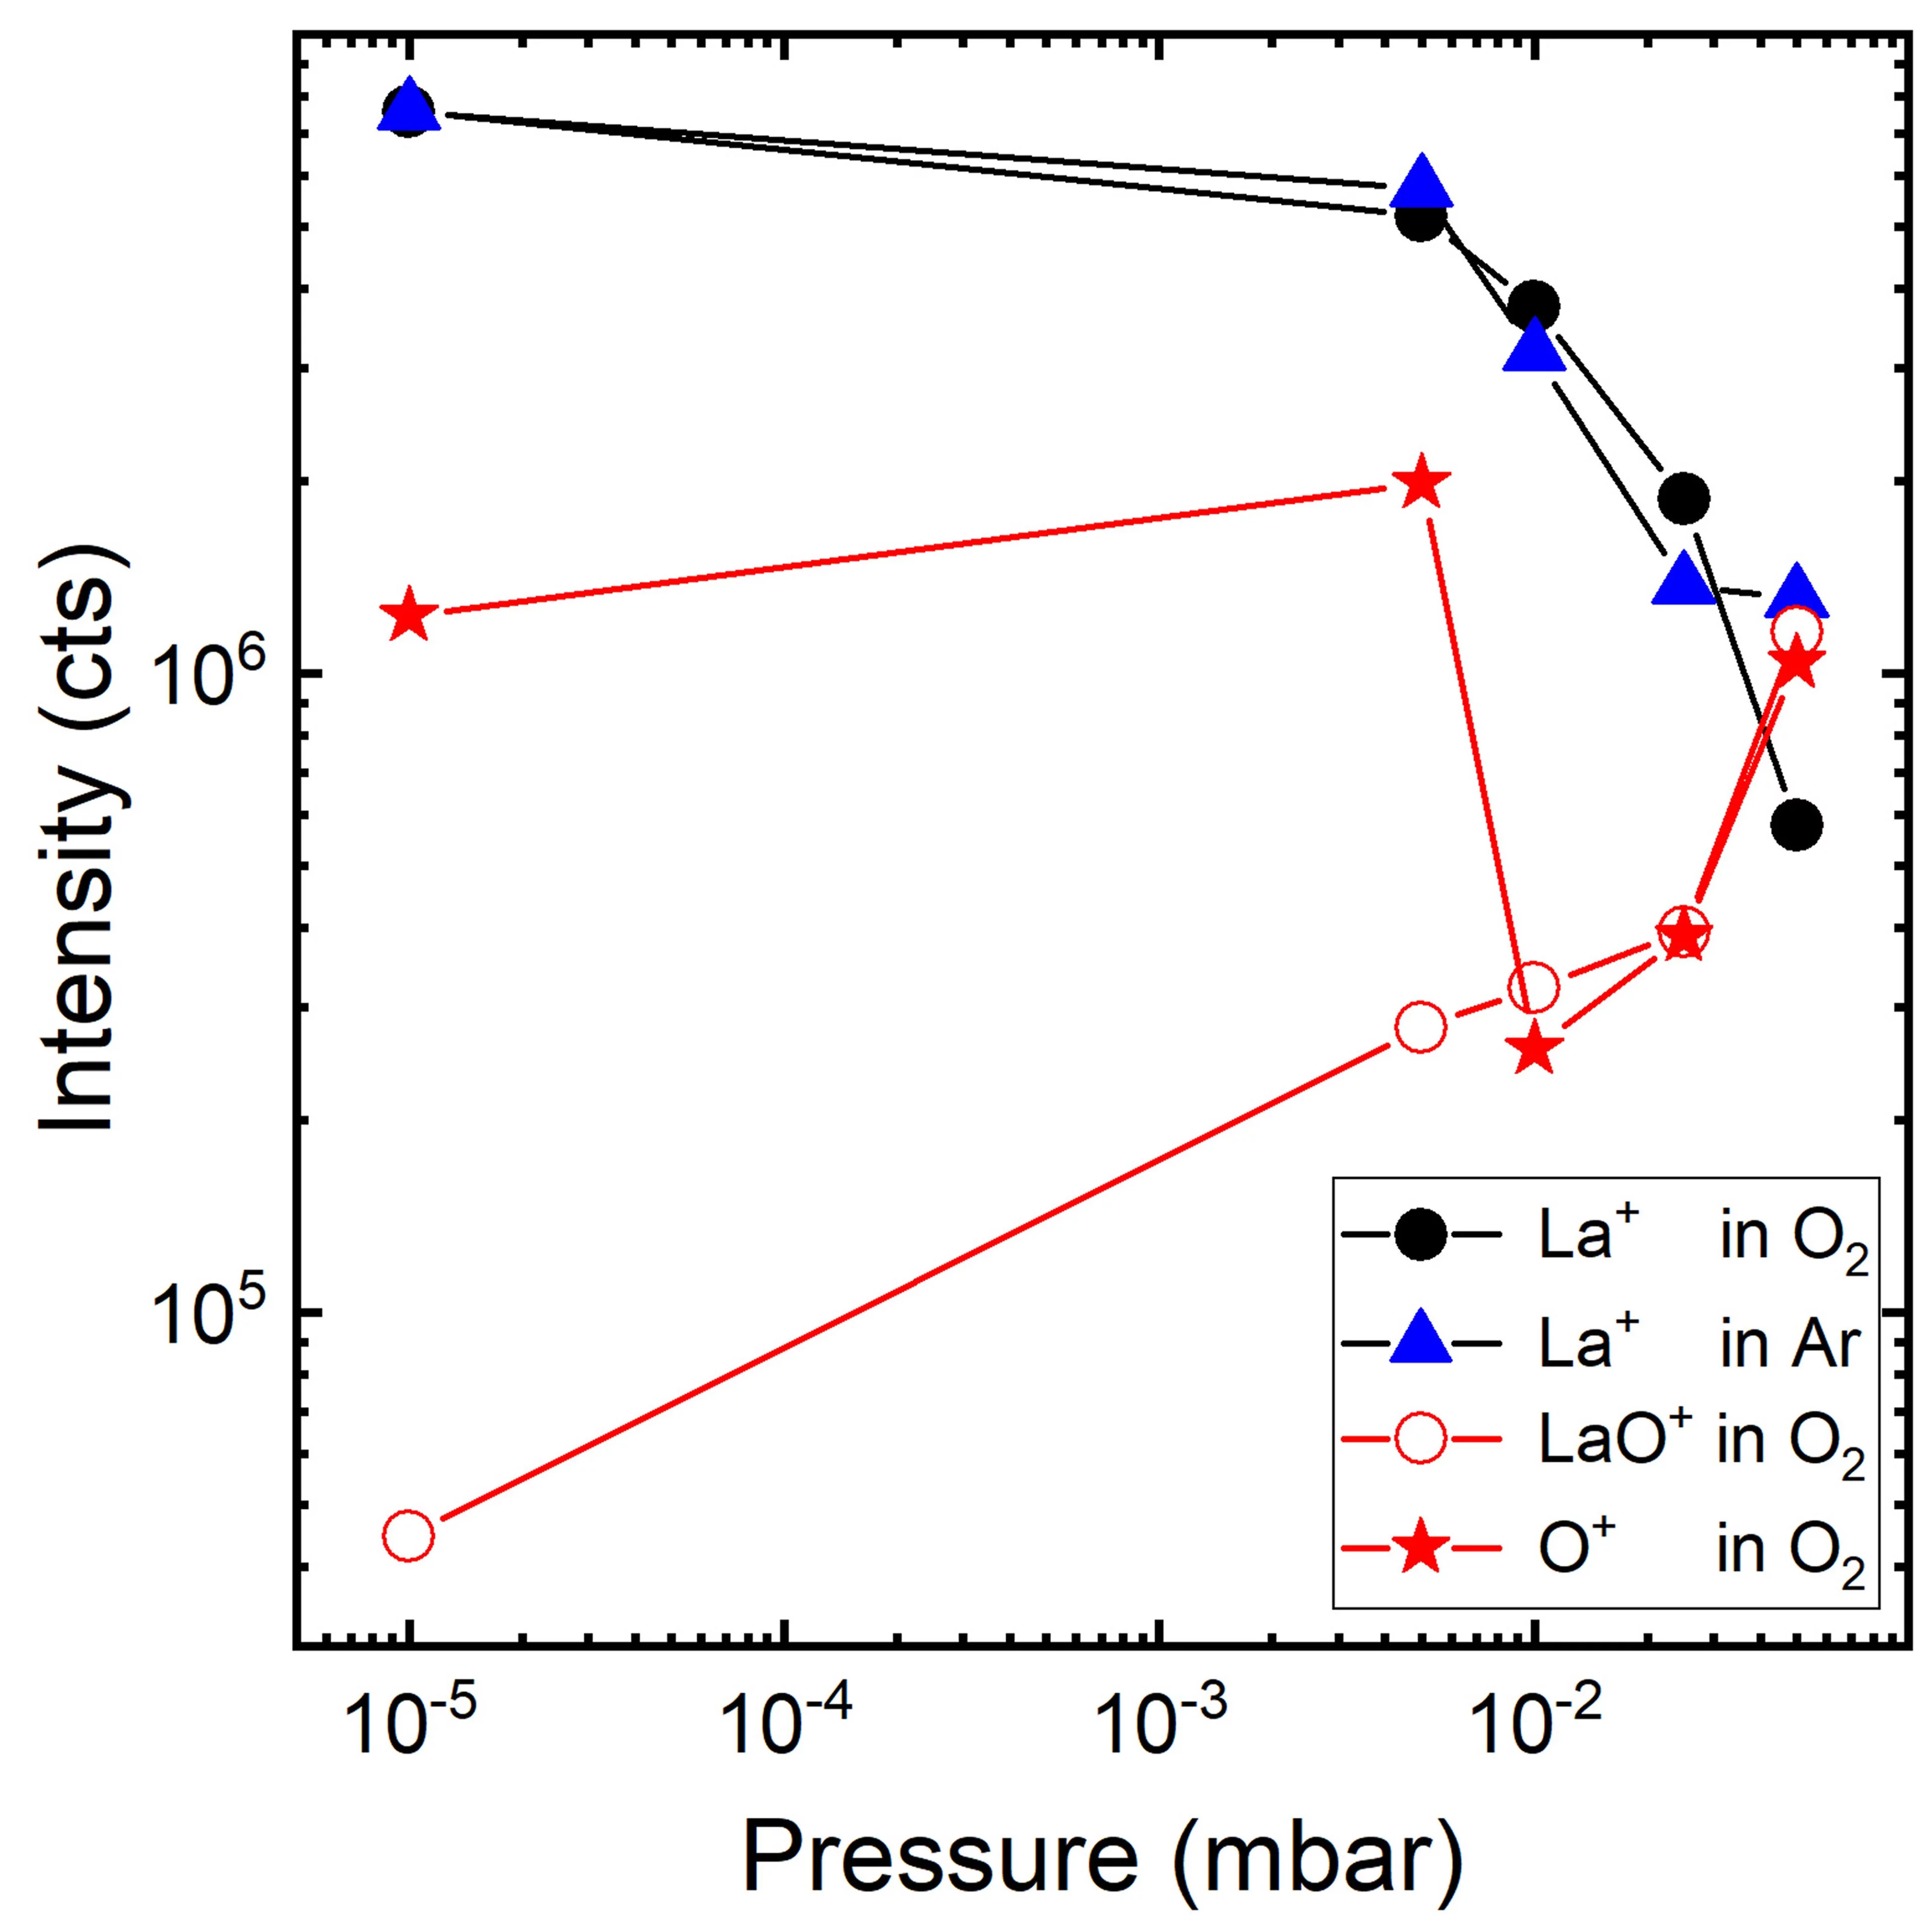
The gas-phase reaction dynamics and kinetics in a laser induced plasma are very much dependent on the interactions of the evaporated target material and the background gas. For metal (M) and metal-oxygen (MO) species ablated in an Ar and O2 background the expansion dynamics in O2 is similar to the expansion dynamics in Ar for M+ ions with an MO+ dissociation energy smaller than O2. This is different for metal ions with an MO+ dissociation energy larger than for O2. Here, the plume expansion in O2 differentiates itself from the expansion in Ar due to the formation of MO+ species. At a high oxygen background pressure, the preferred kinetic energy range to form MO species as a result of chemical reactions in an expanding plasma is up to 5 eV.

The ratio of MO+/(M++MO+) vs. dissociation energy of MO+ species as determined at 1.5×10‑1 mbar O2. The dashed line represents the dissociation energy of O2, Edissoc, O2=5.12 eV .  

Pressure dependence of La+, O+ and LaO+ in O2 and Ar.

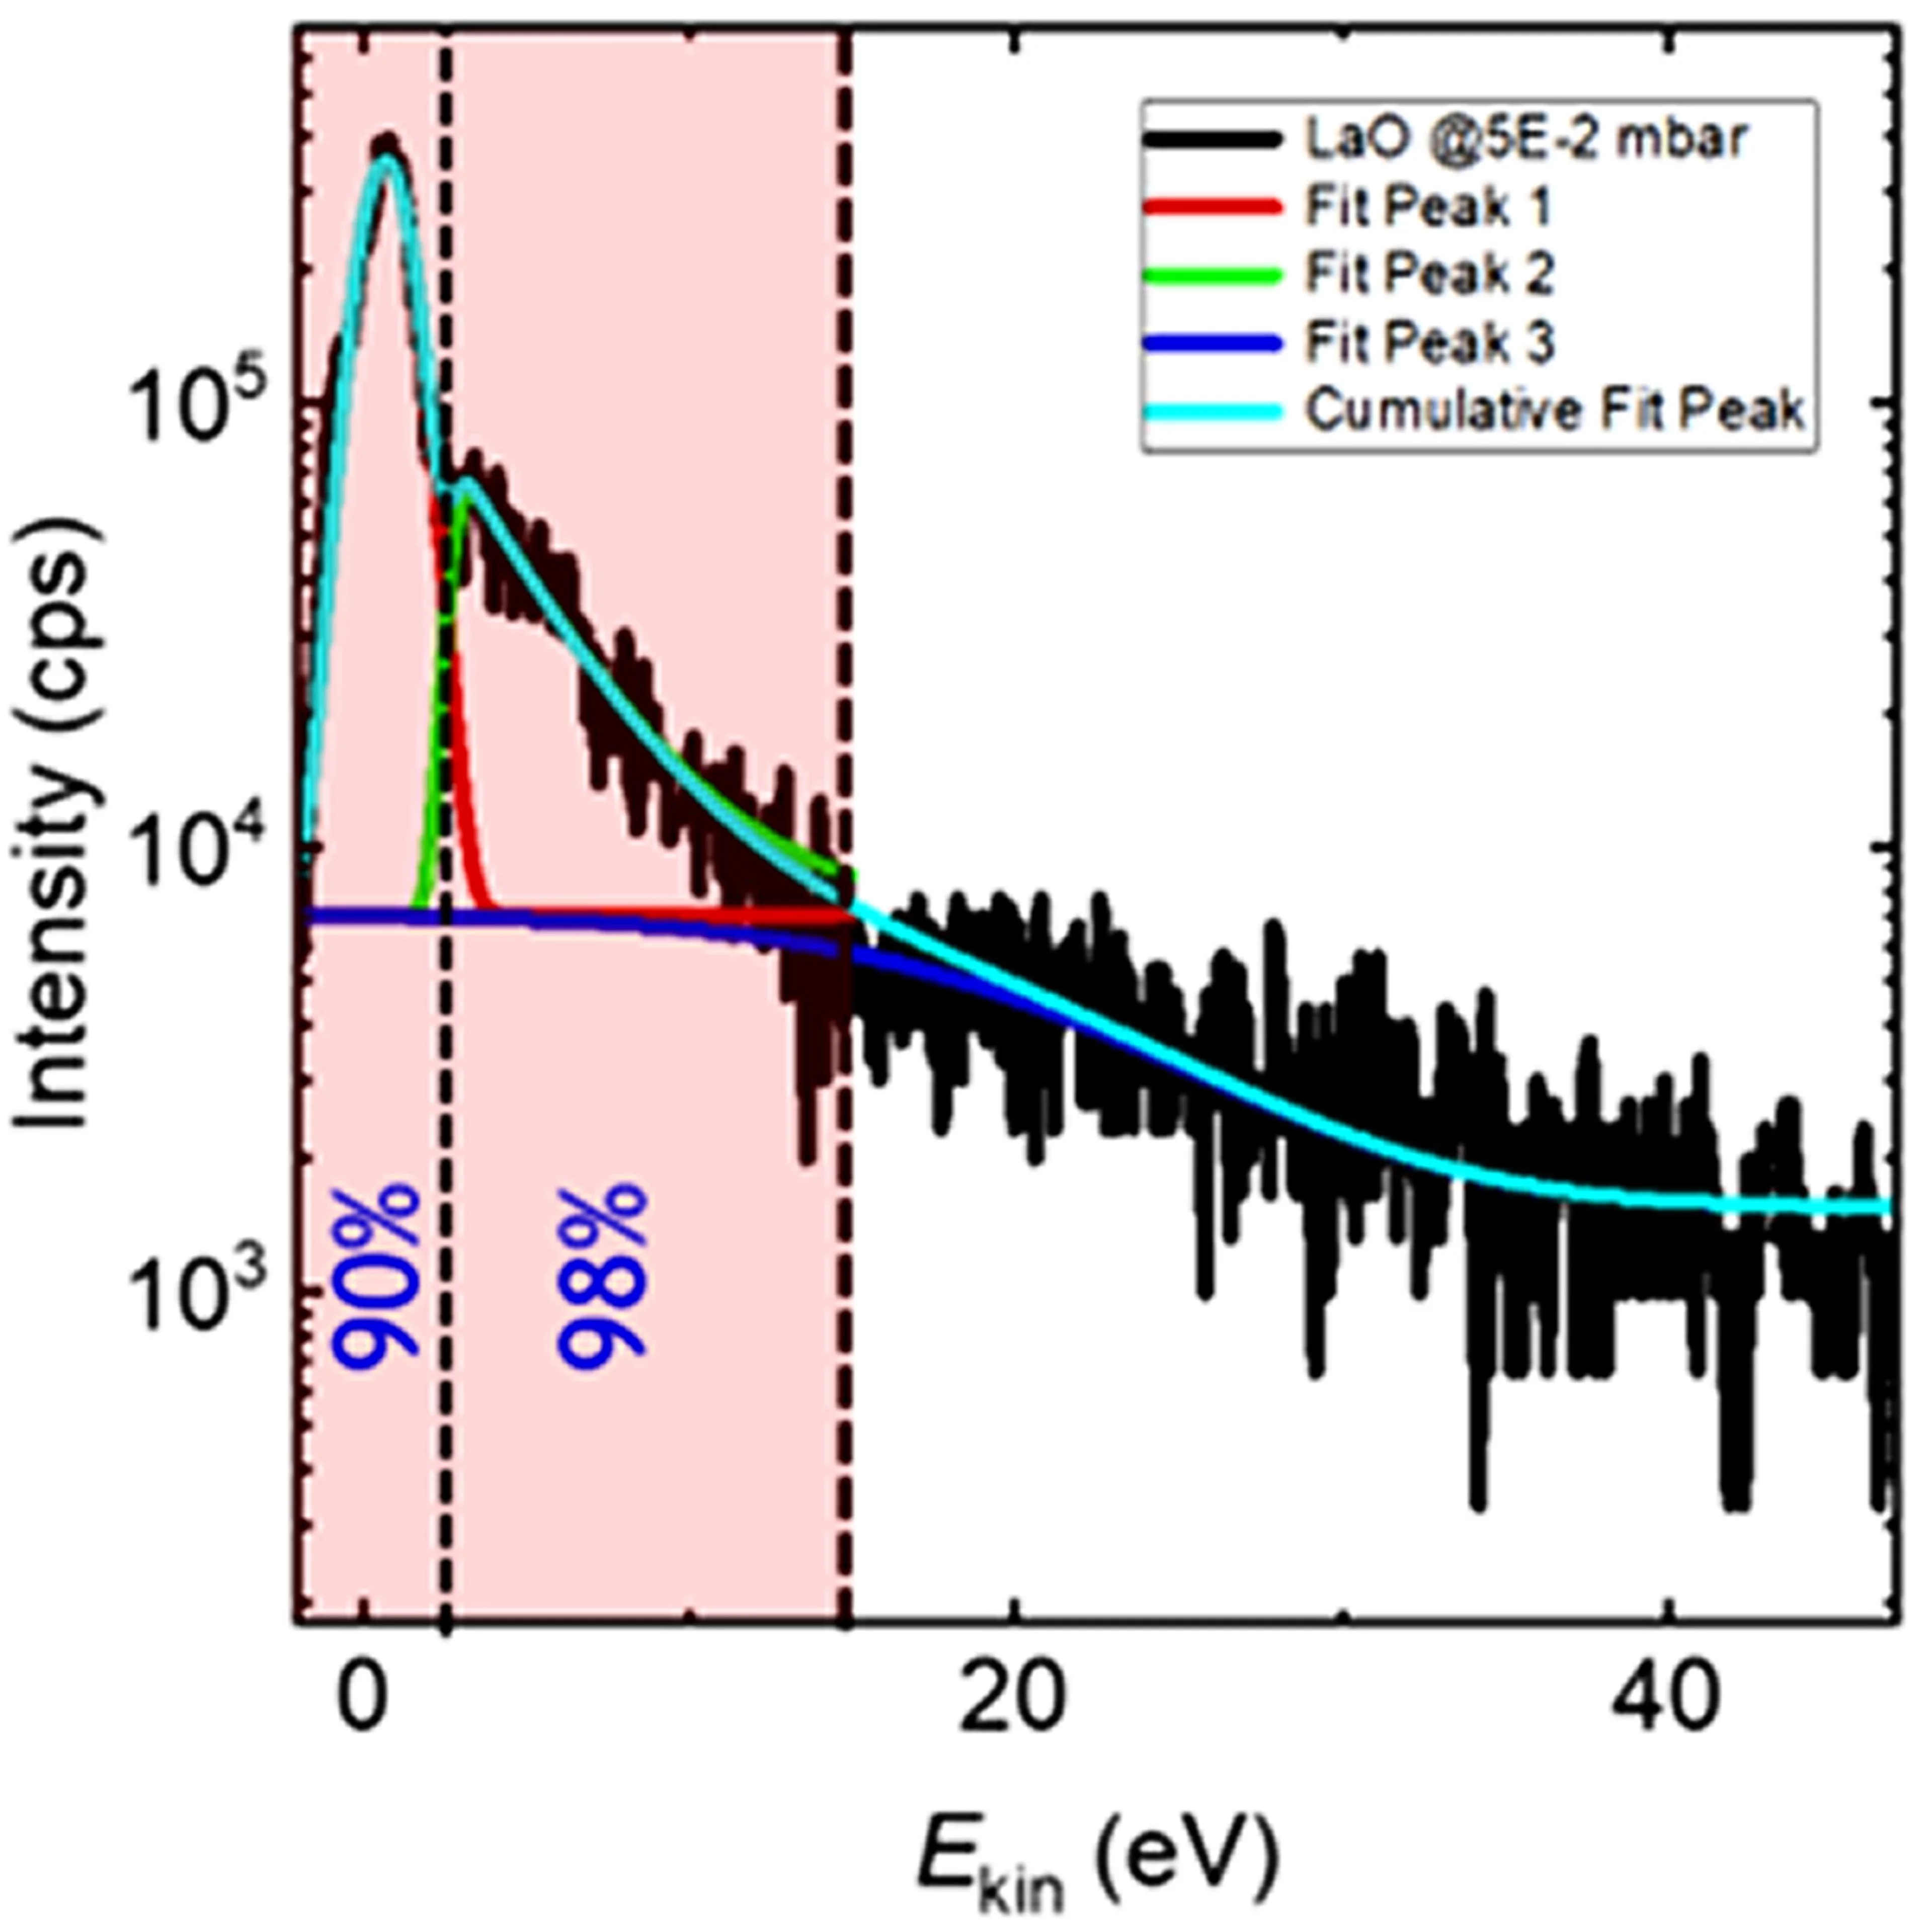
Fitting of ion energy distributions for LaO+ ablated at 5x10⁻² mbar O2 using Maxwell-Boltzmann (MB) distributions. The entire LaO+ vacuum-distribution can be described by three MB velocity distributions. The fitting with three MB functions suggests an approximately 50eV wide window for chemical activity. Between 0-5 eV more than 90% of the measured LaO+  species have been formed, and between 5 and 15 eV 98 % indicating that most LaO+ species have been formed within a kinetic energy window of 15eV. For the La+ species, the maximum Ekinis at ~2.6 eV and the second maximum at ~22 eV. The origin of the slow species is probably related to thermally emitted species after the termination of the laser pulse whereas the faster species are emitted and accelerated within the timescale of the laser pulse and subsequently slowed down.


X. Yao; C. W. Schneider; A. Wokaun; and T. Lippert;
New Insight into the Gas Phase Reaction Dynamics in Pulsed Laser Deposition of Multi-Elemental Oxides
Materials 15, 4862 (2022); DOI: doi.org/10.3390/ma15144862