
Mass spectrometry
Combining quadrupole mass selector with kinetic energy selector

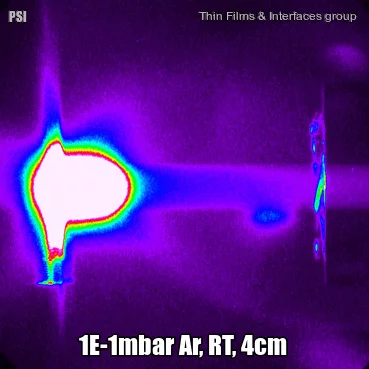
In order to investigate the mass and energy distribution of laser generated plasma species in detail, a quadrupole mass spectrometer with a kinetic energy analyzer is available (Hiden Analytical Inc.). This set up allows the direct measurement of the kinetic energy distributions of positive, negative and neutral plasma species up to 1 keV.
The mass spectroscopy setup enables a better understanding of the species composition (left figure) and their respective energy distribution in the plasma (right figure). Information about the detected positive, negative and neutral species in the laser induced plasma can also be obtained. However, for neutral species only a qualitative analysis is possible to to the unkonwn ionisation cross sections of the arriving species.


Combining the mass spectrometer with a Multichannel Scaler system, the arrival time of plasma species with a defined mass and selected kinetic energies can be measured.
Langmuir probe


Secondary Ion Mass Spectrometry (SIMS)


Plasma Imaging and Spectroscopy
Complementary to mass spectroscopy, we investigate the excited species in the laser induced plasma by emission spectroscopy. The first photo shows the experimental imaging/spectroscopy set-up where an image of the laser induced plasma is projected onto the entrance slid of the monochrometer via the indicated optical beam path. Through the combination of different delay times, we can record a spatially and time resolved emission spectrum of the plasma (top right image). The second image shows a La0.6Ca0.4MnO3 spectrum recorded with the spectrometer set-up between 500 and 520nm. Bottom: excitation lines published in the NIST database for the same wavelenght range.


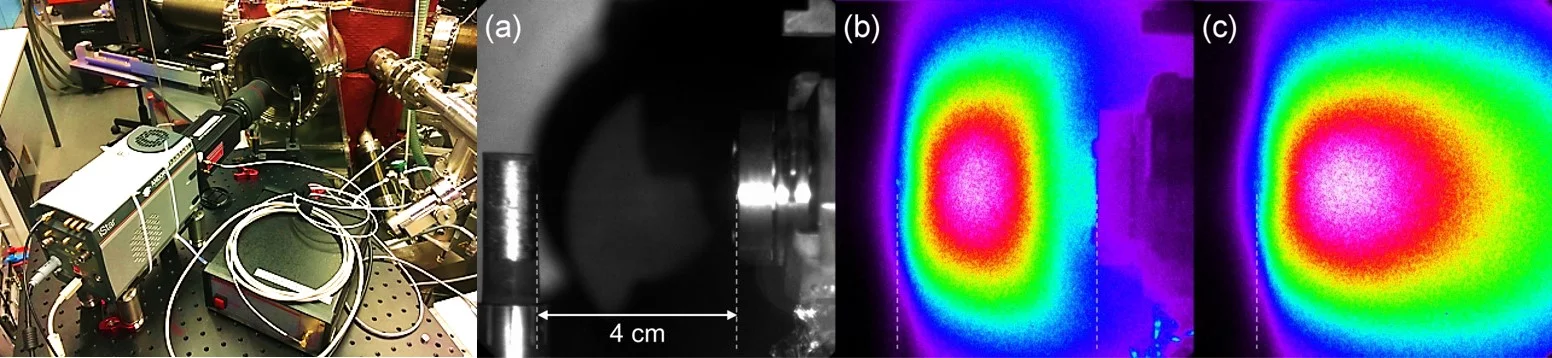
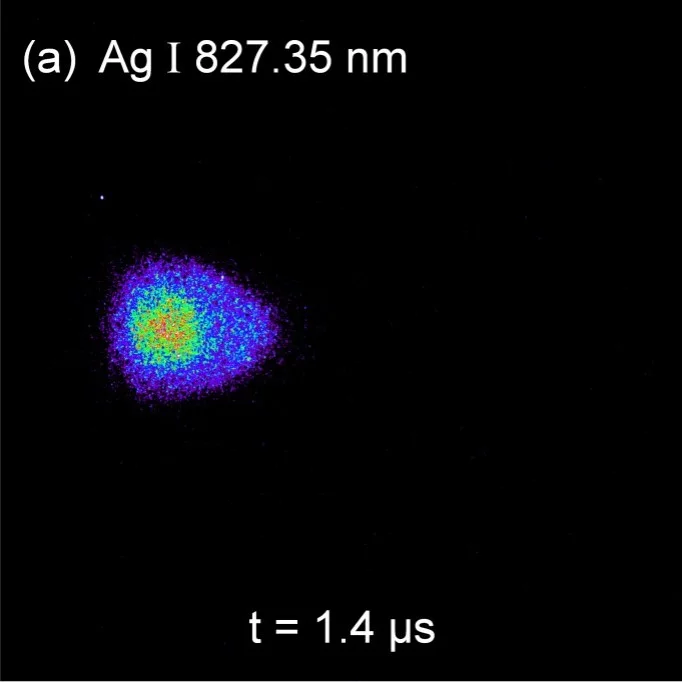
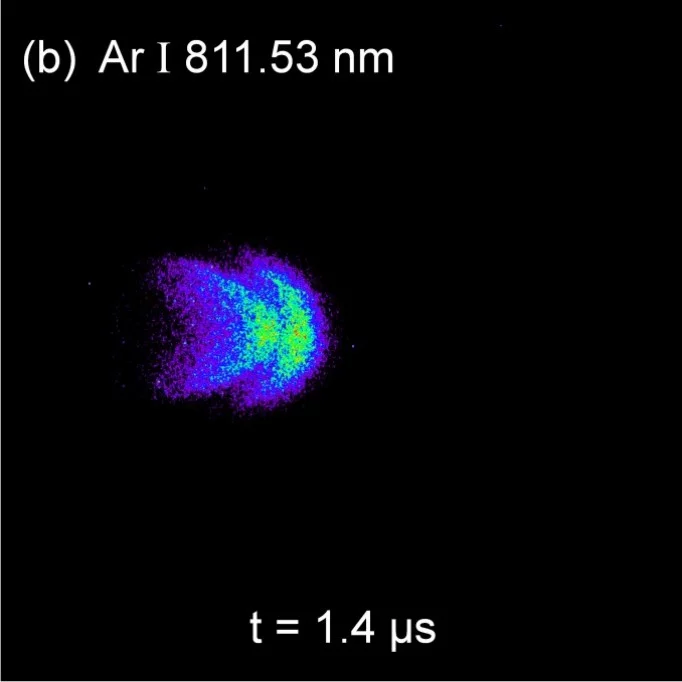
As an example of selected line imaging using an AOTF, the next images show the spatial distributions of Ag and Ar excited neutrals at the same time frame of 1.4µs. The AOTF selected optical excitation lines were 827.35 nm for Ag I and 811.53 nm for Ar I. For each image 100 accumulations were used to increase image resolution. The gradients are normalized to the maximum counts for each image. More details can be found in J. Appl. Phys. 120, 225301 (2016).
Latest Research
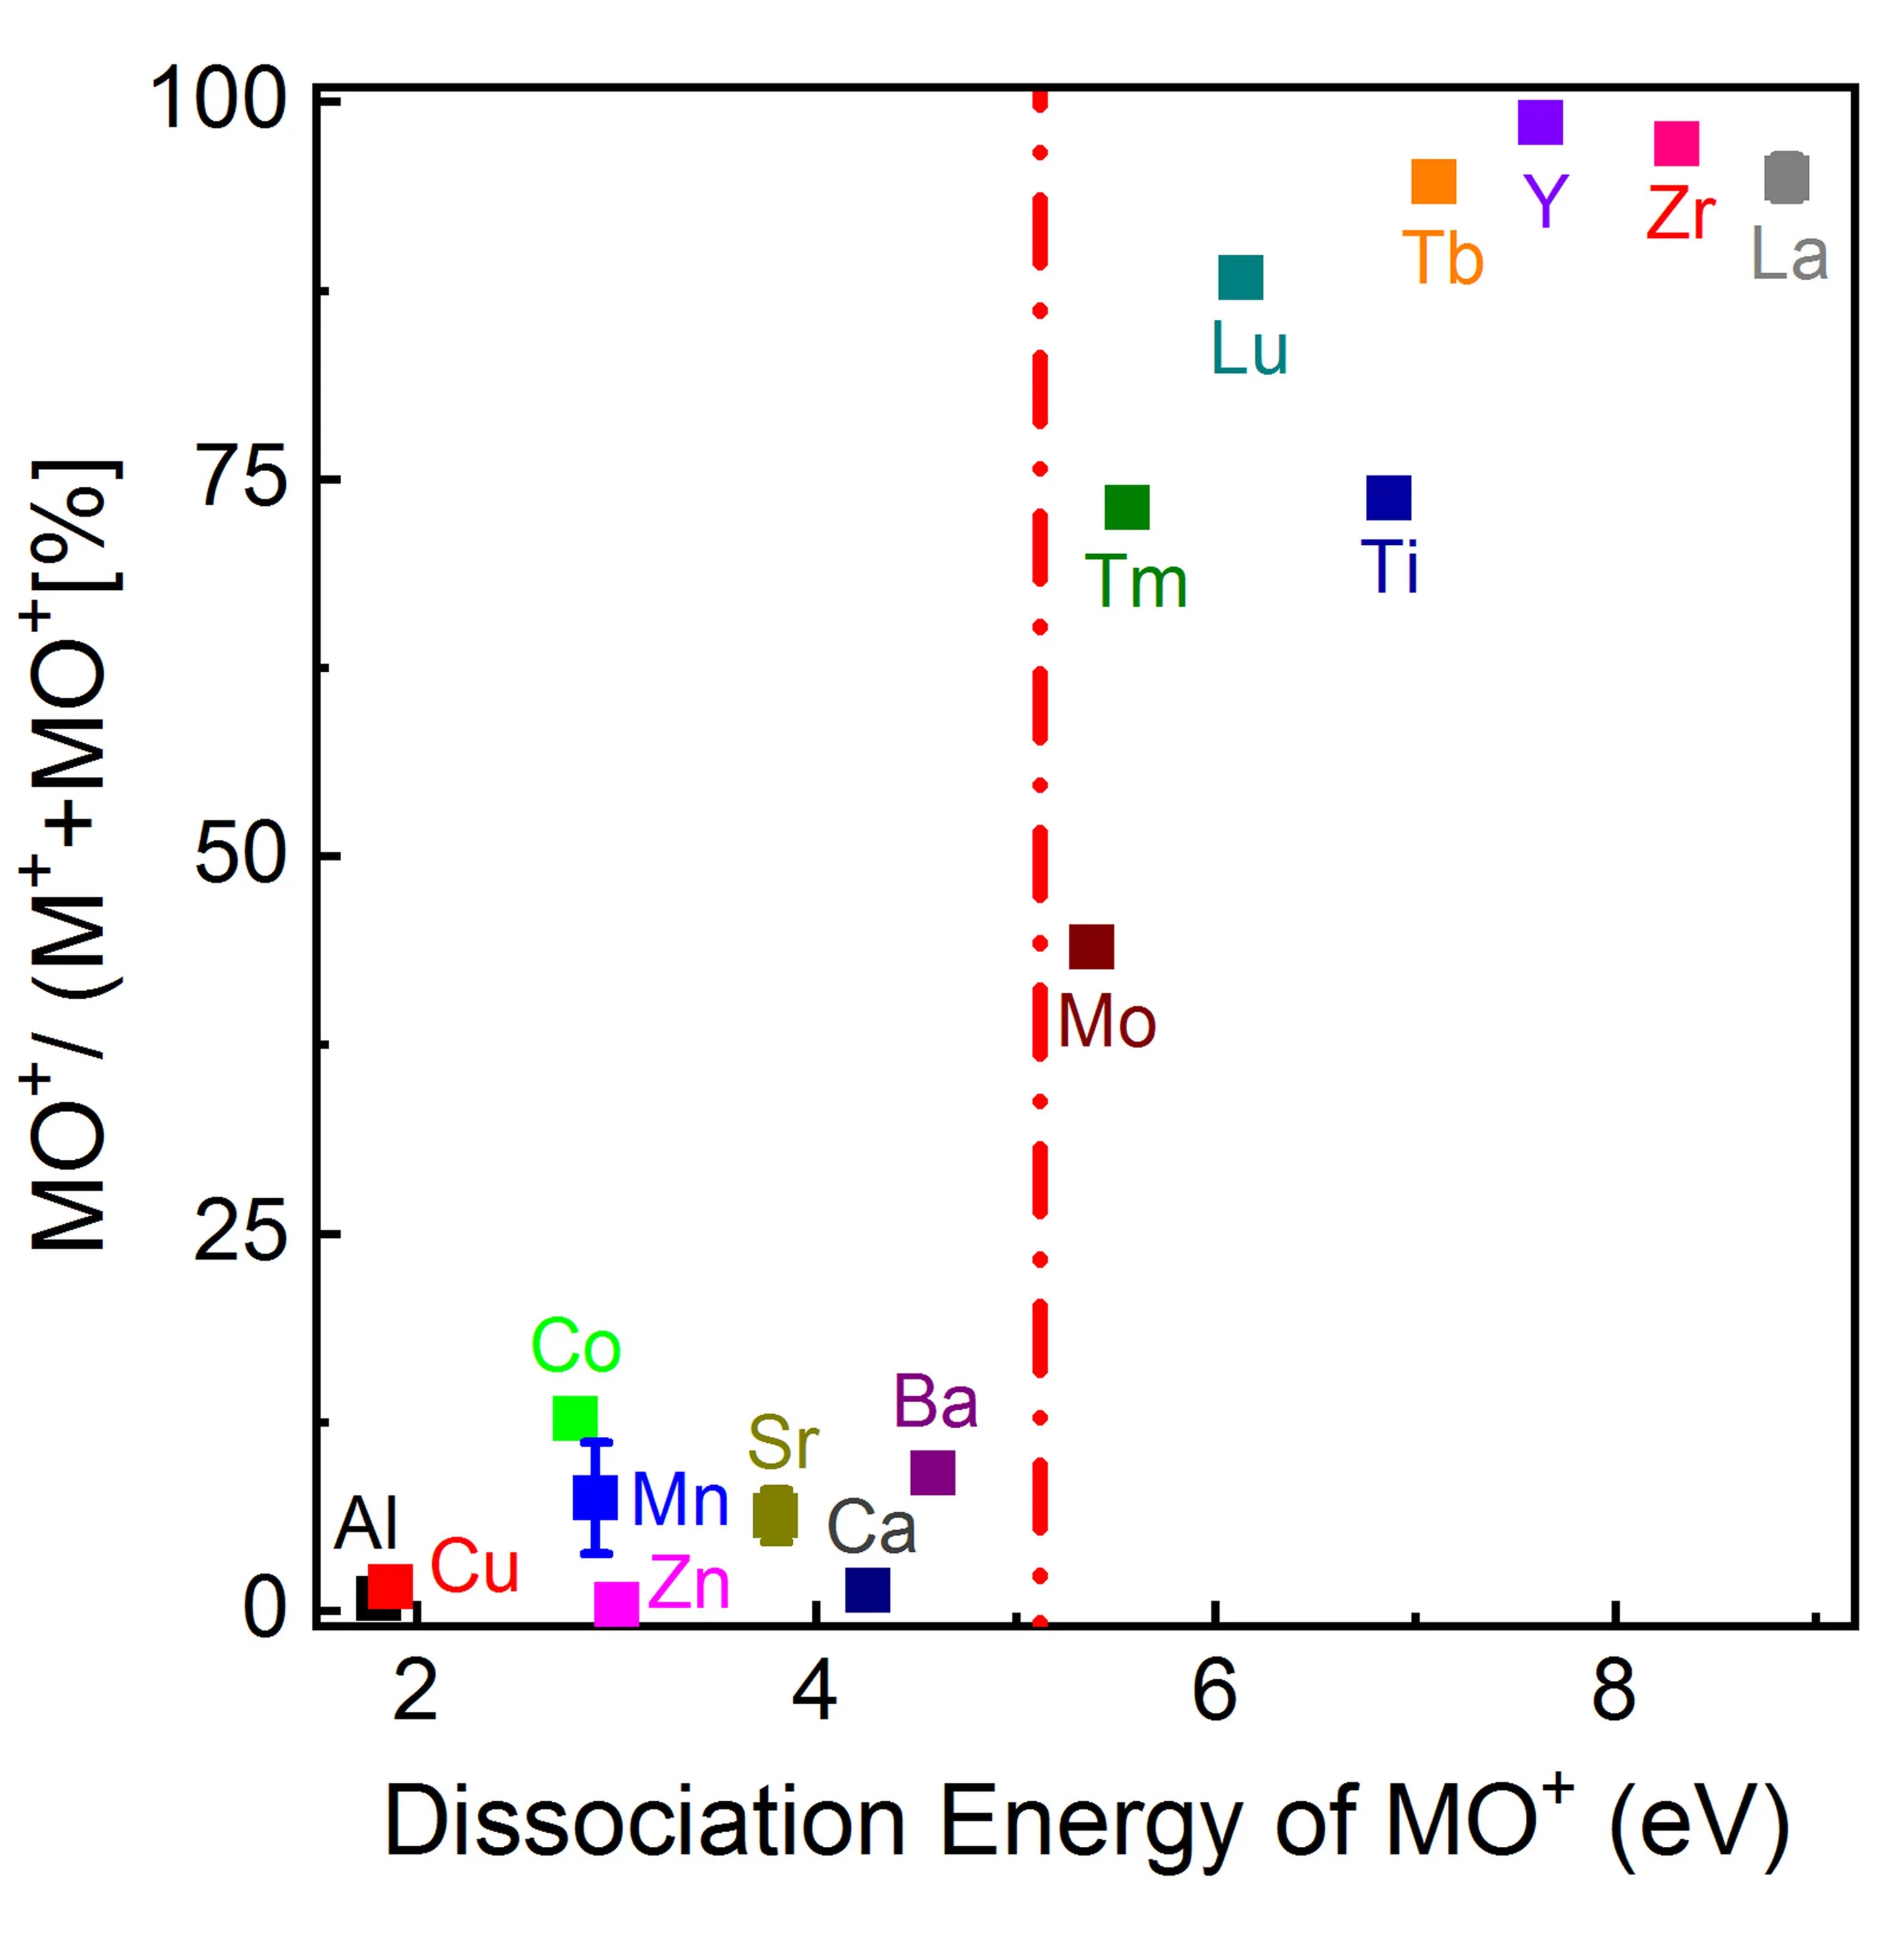
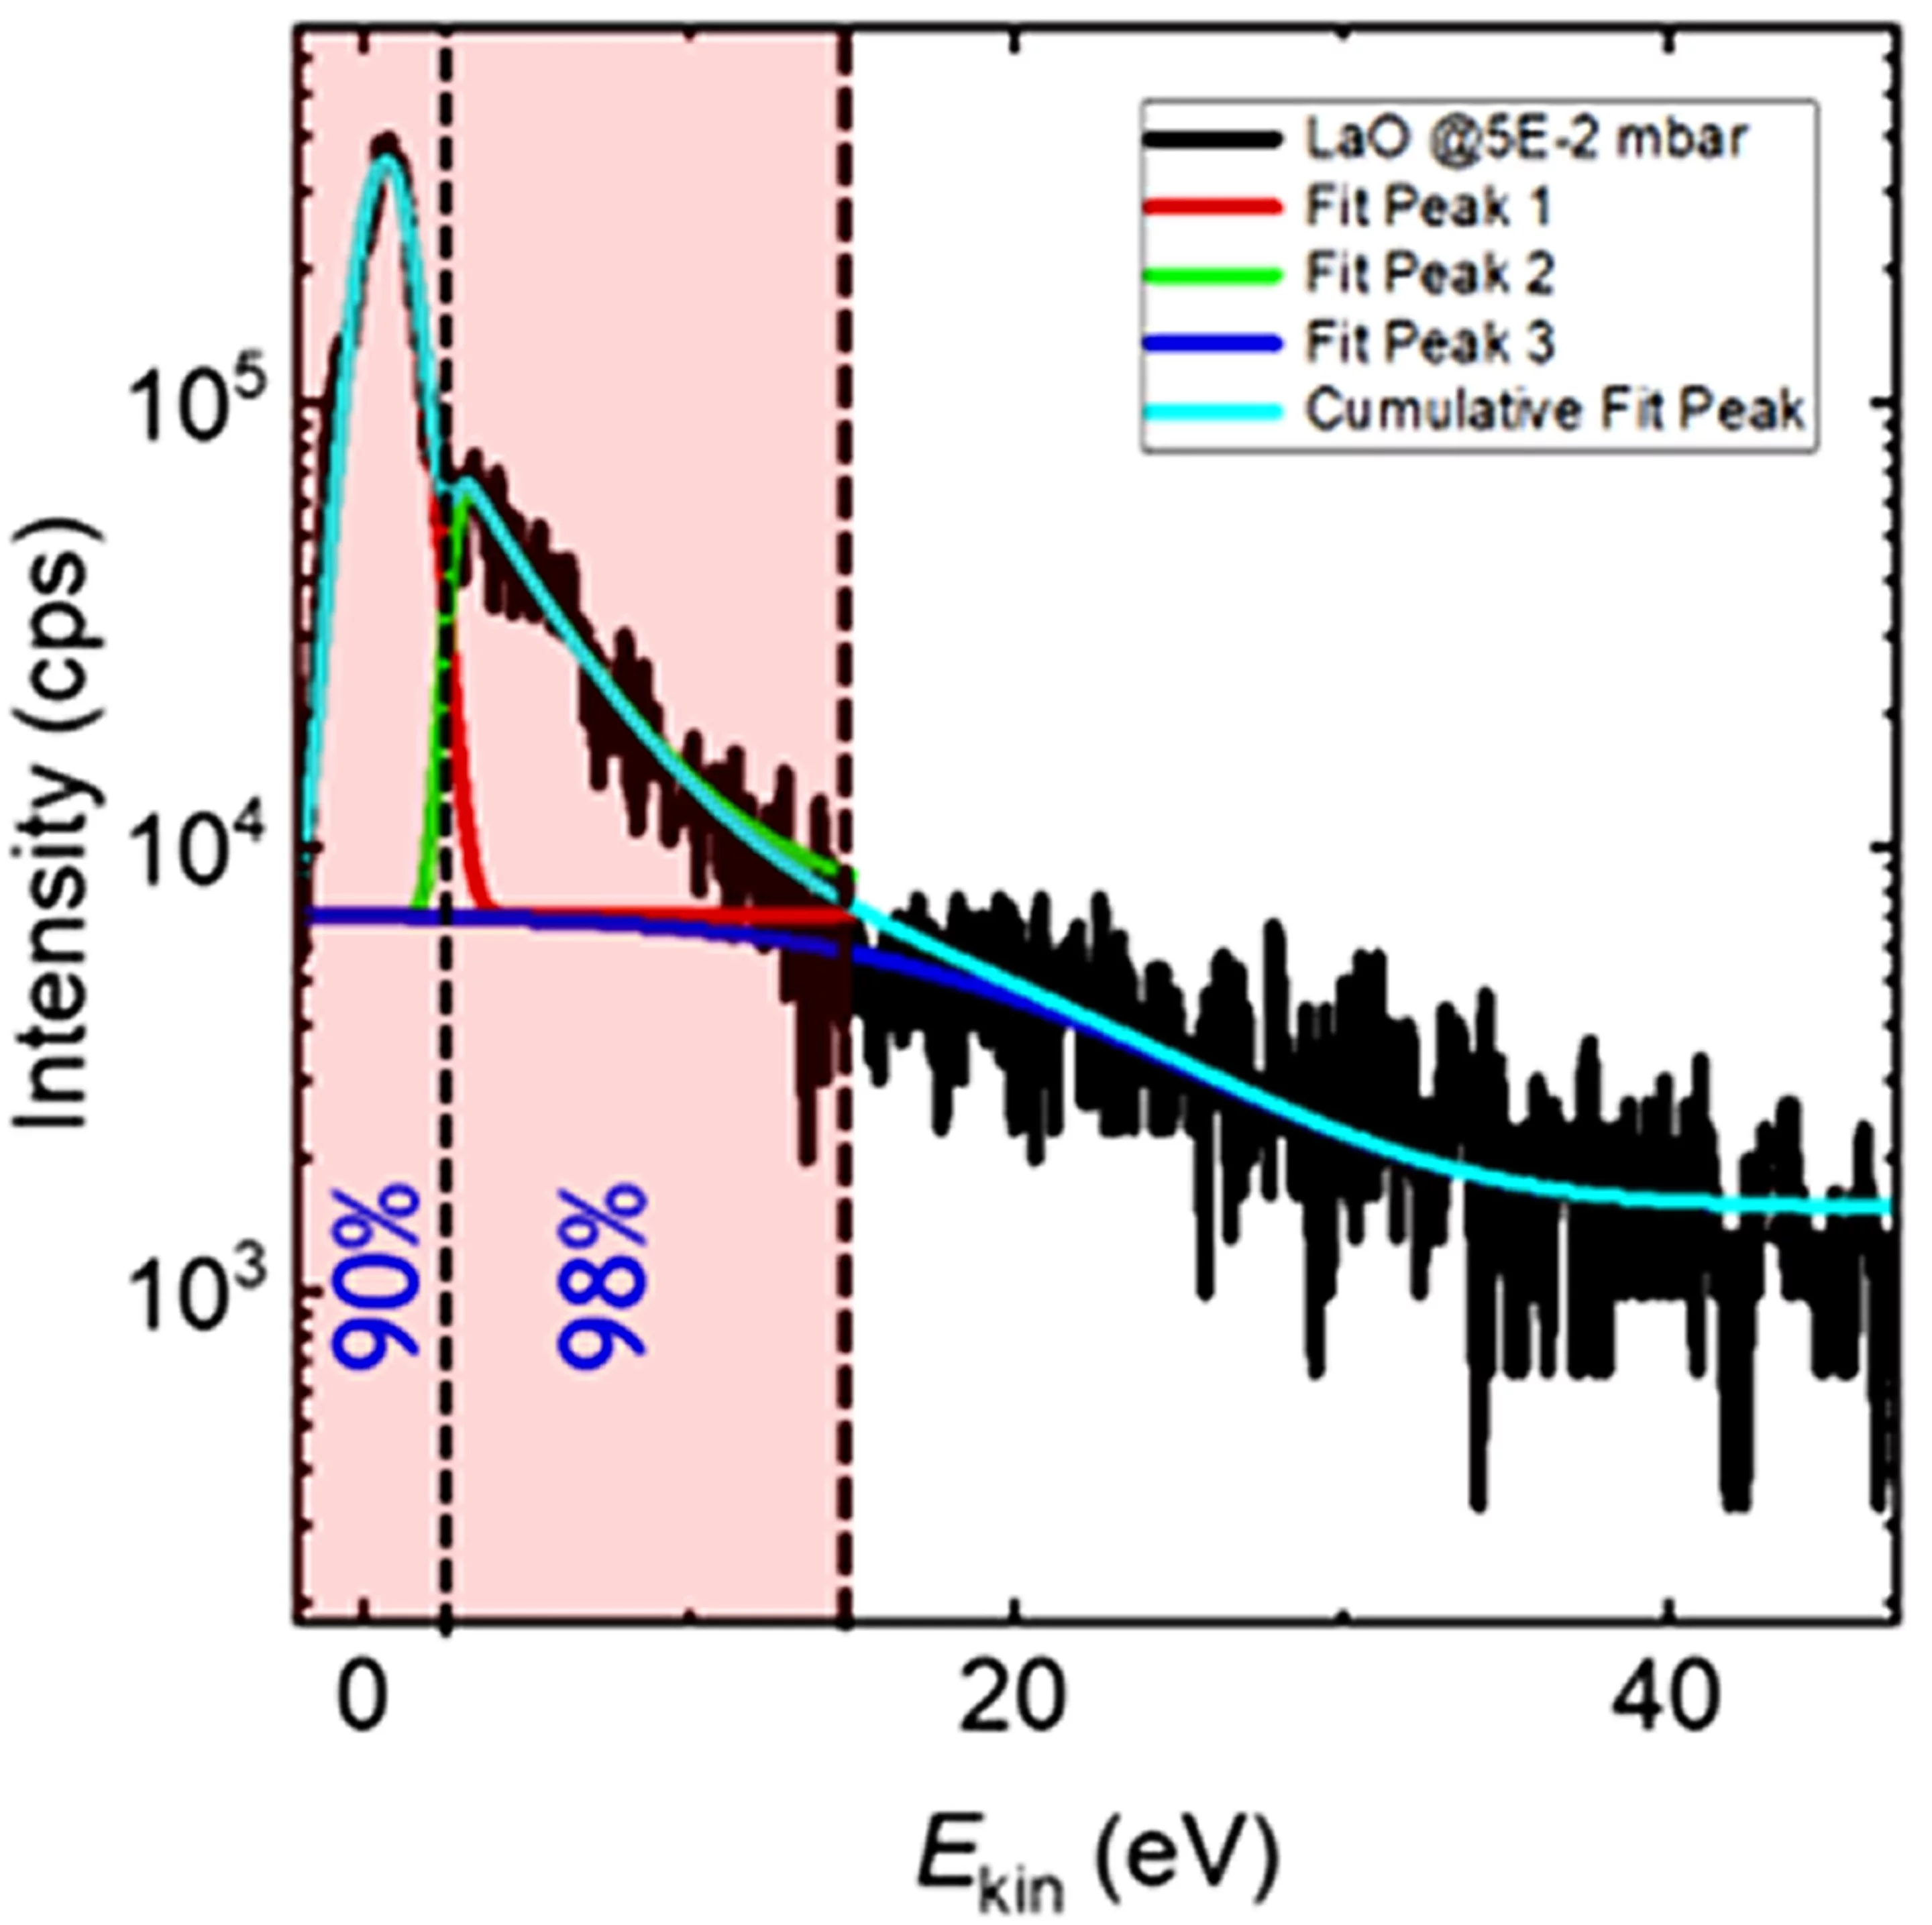
The gas-phase reaction dynamics and kinetics in a laser induced plasma are very much dependent on the interactions of the evaporated target material and the background gas. For metal (M) and metal-oxygen (MO) species ablated in an Ar and O2 background the expansion dynamics in O2 is similar to the expansion dynamics in Ar for M+ ions with an MO+ dissociation energy smaller than O2. This is different for metal ions with an MO+ dissociation energy larger than for O2. Here, the plume expansion in O2 differentiates itself from the expansion in Ar due to the formation of MO+ species. At a high oxygen background pressure, the preferred kinetic energy range to form MO species as a result of chemical reactions in an expanding plasma is up to 5 eV.

X. Yao; C. W. Schneider; A. Wokaun; and T. Lippert;
New Insight into the Gas Phase Reaction Dynamics in Pulsed Laser Deposition of Multi-Elemental Oxides
Materials 15, 4862 (2022); DOI: doi.org/10.3390/ma15144862