
X-ray Tomographic Microscopy
X-ray tomographic microscopy is a powerful technique used to visualize and study the three dimensional (3D) internal structure and material properties of a variety of optically opaque samples in a nondestructive manner. Computed tomography (CT) was introduced in 1973 by Houndsfield [1] and initially applied mostly in the medical field, where it is now well established. With time it became clear that CT is an excellent tool for the investigation of a wider range of specimens and with the advancement of X-ray source and detector technology the achievable spatial resolution reached the micro- (and nano-) meter range. Nowadays, most academic and industrial research departments in many fields such as materials, food, pharmaceuticals, environmental and Earth sciences, are equipped with laboratory-based micro-CT systems, which are routinely used for the nondestructive analysis of the internal microstructure of the most diverse samples.
In X-ray tomographic microscopy, radiographic projections of a sample are acquired. The most widely exploited contrast mechanism is the selective attenuation of the X-ray beam traveling through the sample. For a given beam energy, the number of absorbed photons depends on the sample material (Z-number and electron density): the larger these parameters, the more photons absorbed. Other contrast mechanisms (e.g. phase contrast), rooting to different X-ray matter interaction processes, can also be utilized.
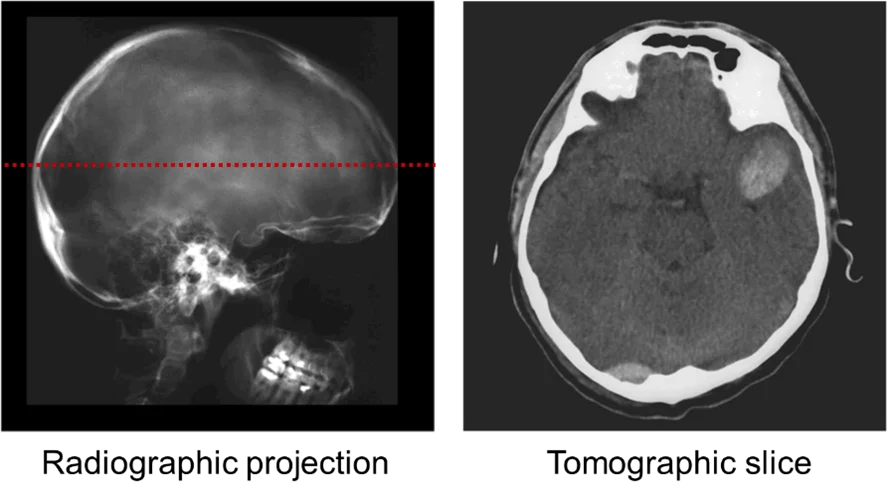
Radiographic projections, however, only provide 2D cumulative information of the structure along the beam path. From a single radiographic projection (Fig. 1, left), it is not possible to determine whether the beam was mostly attenuated when entering or exiting the sample, or maybe homogeneously along its trajectory through the sample. 3D internal structural details (Fig. 1, right) can be revealed by taking radiographs at different sample orientations and combining those using sophisticated mathematical algorithms for tomographic reconstructions based on Fourier analysis (e.g., filtered back-projection) or iterative methods.
Knowledge provided by X-ray tomographic microscopy on the interior of optically opaque objects is immense. In addition to the mere visualization of the 3D internal structural details, extraction of quantitative information is now possible thanks to the ever increasing computational power. Number, size, shape, orientation, spatial distribution, connectivity and packing of features of interest in the analyzed volume are just a few of the possible quantitative metrics which can be extracted from tomographic datasets. If adequate calibration measurements are performed, X-ray tomographic microscopy can also provide insight into composition (e.g., bone mineralization).
Advantages of Synchrotron Radiation
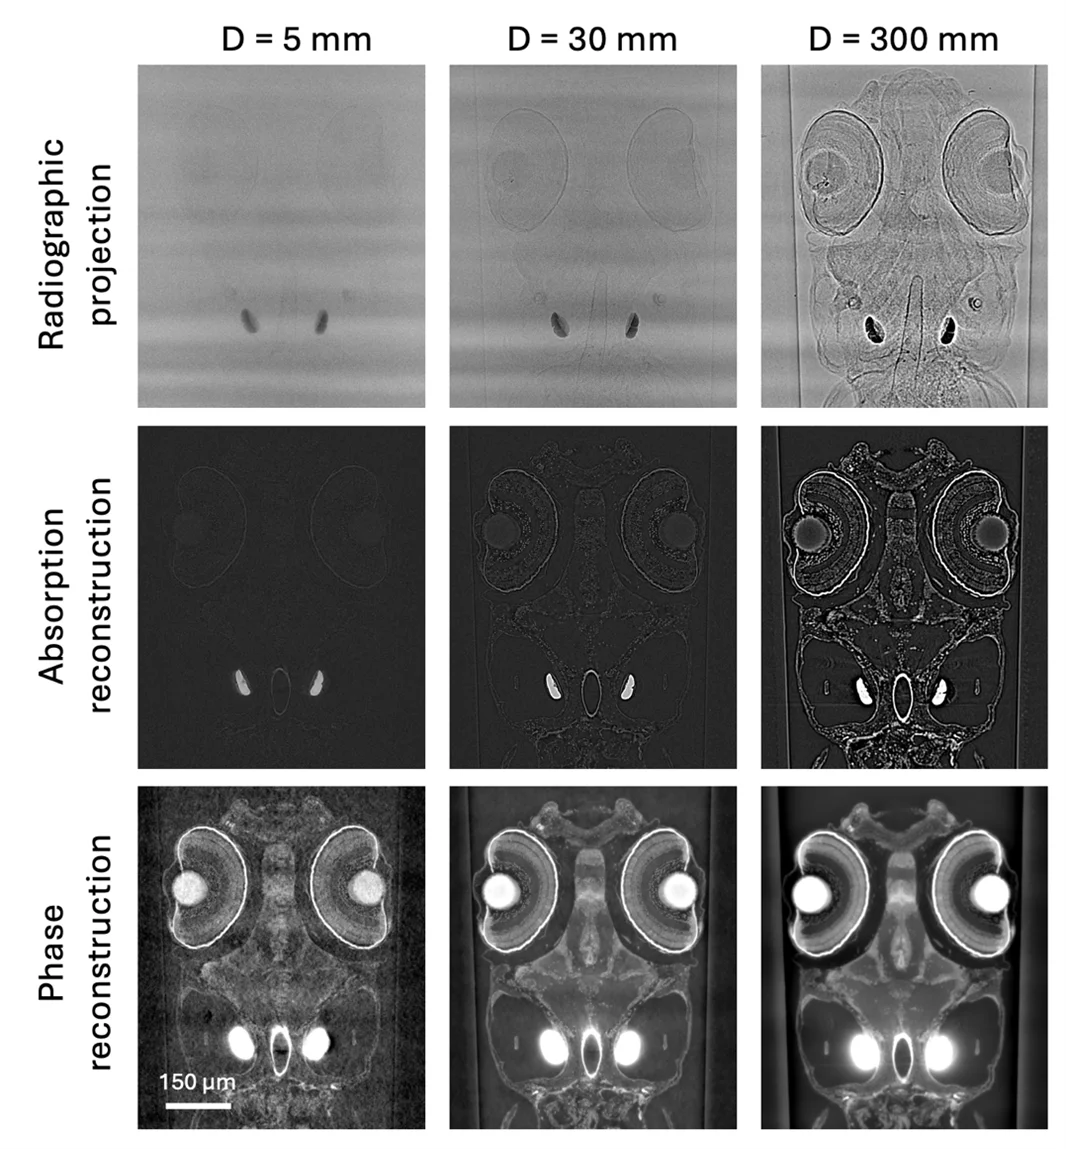
At third generation synchrotron sources, thanks to a very intense and coherent beam, X-ray imaging has experienced a true revolution. The tremendous photon density reached by these sources brings huge advantages with respect to traditional X-ray laboratory instruments. The high brilliance of synchrotron light provides increased spatial and temporal resolution: detection of details as small as 1 micron in millimeter-sized samples is routinely possible within only a few minutes. In addition, the monochromaticity of the X-ray beam makes quantitative measurements of material properties possible and vastly simplifies the identification of different phases, since beam hardening artifacts, distinctive for laboratory setups, can be avoided. Increased contrast and reduced noise are also promoted by the monochromatic beam and the high photon flux. Furthermore, the spatial coherence peculiar to synchrotron radiation enables, using different phase contrast techniques, to boost contrast in low absorbing or similar Z-number materials, such as soft tissue. Phase contrast leverages on the refraction of the beam interacting with the sample and the resulting interference phenomena. Moreover the almost parallel beam geometry usual at tomographic microscopy endstations at synchrotron sources permits the accurate reconstruction of tomographic volumes without cone beam artifacts. The combination of these factors contributes to the astonishing quality of the resulting images.
Finally the latest detector generation based on CMOS technology coupled with the highly brilliant synchrotron radiation has made sub-second temporal resolution a reality. In this way, previously unimaginable new science and experiments, where fast dynamic processes can be captured for the first time in 3D through time [2], are now possible.
The new fourth generation X-ray sources, such as the SLS 2.0 machine, will provide an even brighter and more coherent beam boosting image quality to an unprecedented level and unlocking for the first time simultaneous higher spatial and temporal resolutions, pushing dynamic tomographic imaging towards unexplored frontiers.
References
- G. N. Hounsfield, Computerized transverse axial scanning (tomography): Part 1. Description of system, Br J Radiol, 46, 1016-1022 (1973).
- R. Mokso, D. A. Schwyn, S. M. Walker, M. Doube, M. Wicklein, T. Müller, M. Stampanoni, G. K. Taylor, and H. G. Krapp, "Four-dimensional in vivo X-ray microscopy with projection-guided gating", Scientific Reports 5, 8727 (2015).
References
- D. Paganin, S. C. Mayo, T. E. Gureyev, P. R. Miller, and S. W. Wilkins, “Simultaneous phase and amplitude extraction from a single defocused image of a homogeneous object”, Journal of Microscopy 206, 33-40 (2002)
- T. Weitkamp, A. Diaz, C. David, F. Pfeiffer, M. Stampanoni, P. Cloetens, and E. Ziegler, “X-ray phase imaging with a grating interferometer”, Optics Express 13(16), 6296-6304 (2005)
- D. Chapman, W. Thomlinson, R. E. Johnston, D. Washburn, E. Pisano, N. Gmur, et al., “Diffraction enhanced x-ray imaging”, Physics in Medicine and Biology 42(11), 2015-2025 (1997)
- P. Cloetens, W. Ludwig, J. Baruchel, D. Van Dyck, J. Van Landuyt, J. P. Guigay, and M. Schlenker, “Holotomography: Quantitative phase tomography with micrometer resolution using hard synchrotron radiation x rays”, Applied Physics Letters 75(19), 2912-2914 (1999)
TOMCAT offers world-leading capabilities for a continuous, ultra-fast acquisition of tomographic datasets. The dynamic evolution of samples under in situ, operando, or in vivo conditions can be investigated by measuring a rapid series of 3D volume data sets as a function of time (4D dataset). Individual 3D volume data sets consisting of hundreds to thousands of radiographic projections can be measured in typically well under one second, and thanks to the in-house development of the GigaFRoST high-speed camera and readout system, the total duration of data acquisition is no longer limited by the on-board camera memory. Data are streamed directly to a data acquisition server providing a high data throughput of nearly 8 GB/s, real-time preview capabilities, as well as sophisticated protocols for triggering, gating, and selective storage of data.
The high-speed setup is compatible with the usual absorption and single distance propagation-based phase contrast tomography modalities. In practice, phase contrast is almost always the contrast mechanism of choice since it yields much better contrast for the typically very noisy and low intensity data acquired at high frame rates. Data can be acquired either using the high bandwidth monochromatic beam from the multilayer monochromator, or using a filtered white beam at S-TOMCAT. The GigaFRoST camera is, in principle, compatible with all of the TOMCAT microscope choices (see the section on Detectors). Naturally, the necessary acquisition time increases when choosing smaller pixel sizes.
Typical detector frame rates for the fast measurements range from 1 kHz at full frame to up to 20 kHz using a reduced region of interest (ROI) on the detector. The achievable frame rates as a function of ROI sizes are listed in the following table:
ROI size(hxv) | Max. frame rate |
|
|
|---|---|---|---|
2016 x 2016 | 1’255 |
|
|
2016 x 1008 | 2’490 |
|
|
1008 x 1008 | 4’305 |
|
|
672 x 540 | 10’288 |
|
|
480 x 288 | 21’907 |
|
|
240 x 240 | 33’875 |
|
|
For an in-depth description of the GigaFRoST camera system refer to R. Mokso, C. M. Schlepütz, G. Theidel, H. Billich, E. Schmid, T. Celcer, et al., "GigaFRoST: The Gigabit Fast Readout System for Tomography", J. Synchrotron Rad., 24 (6), 1250-1259 (2017). DOI: 10.1107/S1600577517013522.
TOMCAT can accommodate various user-built sample environments (for example, compression or tensile rigs, heating or cooling stages, electrochemical sample cells, etc.) and also offers use of an in-house developed laser furnace for high temperature studies. Please contact a beamline scientist to discuss your experimental ideas and requirements in detail.
Some more technical information about the end station capabilities for time-resolved tomography can be found, for example, in the following article: G. Lovrić, R. Mokso, C. M. Schlepütz, and M. Stampanoni, "A multi-purpose imaging endstation for high-resolution micrometer-scaled sub-second tomography", Physica Medica, 32, 1771 (2016). DOI: 10.1016/j.ejmp.2016.08.012
TOMCAT Nanoscope
Linking micrometer and nanometer scales, the TOMCAT nanoscope was commissioned in 2009 and used until September 2023. Based on Zernike phase contrast, this full-field microscope was composed of:
- a condenser: a custom designed beamshaper producing a top-flat illumination in the focal plane
- a series of Fresnel Zone Plates (FZP) objectives, with different diameters on the same frame (to be selected according to the working energy)
- phase dots (optional) placed at the back-focal distance of the FZP to generate Zernike phase contrast.
The detector, placed downstream about 10 m, records the magnified phase contrast image of the sample. The field-of-view was from about 75um2.
Thanks to the latest improvements in optical design, specifically with regards to the beamshaper and the Fresnel Zone Plate, as well as on the hardware of the setup itself to produce higher stability, the nanoscope could be used with 8 keV to 20 keV monochromatic beam (multilayer or silicon monochromator mode), which led to a pixel size down to 65nm (approximately 150/200 nm spatial resolution). The setup was used in absorption or phase contrast mode for a wide range of applications, including biology, geology, materials science, and paleontology.

Axicon TXM
An Axicon TXM will be installed at I-TOMCAT. More information will be available soon.
The multiscale protocol at TOMCAT [1] utilizes at least two X-ray microscopes mounted in series or in parallel. The acquisition methodology has been optimized such that the sample is first imaged, entirely, if possible, at low resolution (LR). After reconstruction of these LR datasets, one or several small regions of interest (ROIs), anticipated to exhibit significant features, are selected using a dedicated Fiji Plugin [2]. Without further manipulation of the sample, a medium resolution (MR) or higher resolution (HR) acquisition is then performed locally. Thus, multiscale X-ray tomography allows for the assessment of the overall geometry and internal macro-structure of the specimen, along with the ability to perform detailed morphological evaluations of specific microstructures in selected areas.
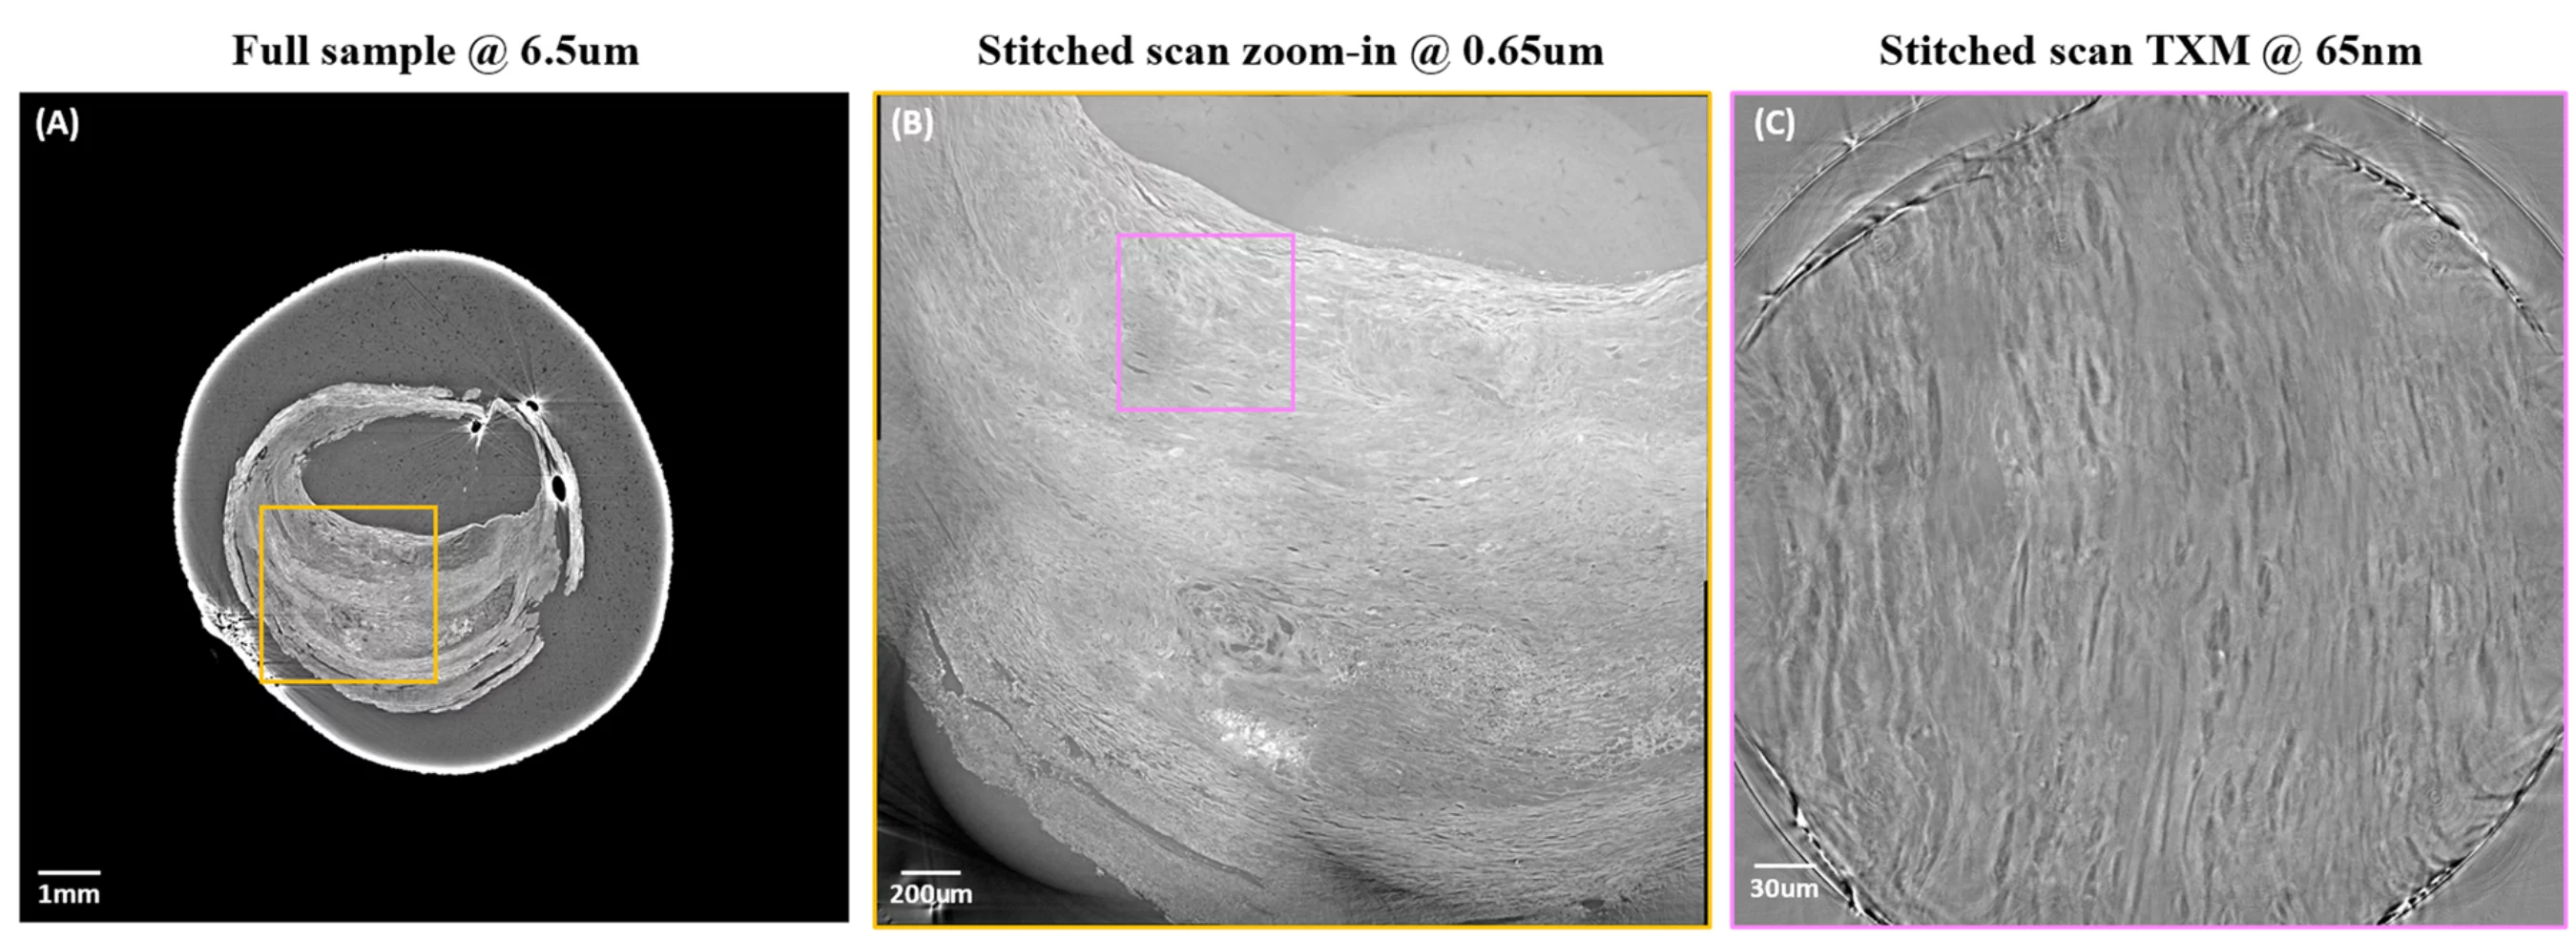
As an example, Figure 1 below shows multiscale imaging of an atherosclerotic plaque using the standard propagation-based X-ray tomographic microscopy in combination with the TOMCAT nanoscope on SLS1.0 [3]. Samples embedded in a paraffin block have been first investigated at 6.5 um and 0.65 um pixel size [4]. The results revealed numerous features typical of advanced atherosclerotic plaques, such as ruptures with thrombosis, neo-vascularization, inflammatory infiltrates, and lipid-rich necrotic cores. Eager to visualize even more detailed areas, biopsy samples have been punched [5] in selected areas of the paraffin blocks and investigated with the TOMCAT nanoscope with an effective pixel size of 65 nm.
References
- Bonnin A, Lovric G, Marone F, Olbinado M, Schlepütz CM, Stampanoni M, Multiscale synchrotron propagation-based phase-contrast X-ray tomographic microscopy at the TOMCAT beamline: latest achievements and future plans, Synchrotron Radiation News. 2024; 37(5): 4-6.
- Dejea H, Garcia-Canadilla P, Cook AC, Guasch E, Zamora M, Crispi F, et al., Comprehensive analysis of animal models of cardiovascular disease using multiscale X-ray phase contrast tomography, Scientific Reports. 2019; 9(1): 6996 (12 pp.).
- Stampanoni M, Mokso R, Marone F, Vila-Comamala J, Gorelick S, Trtik P, et al., Phase-contrast tomography at the nanoscale using hard x rays, Physical Review B. 2010; 81(14): 140105(R) (4 pp.).
- Truong M, Dreier T, Wassélius J, Sundius L, Persson A, Lovric G, et al., Sub-micrometer morphology of human atherosclerotic plaque revealed by synchrotron radiation-based μCT-A comparison with histology, PLoS One. 2022; 17(4): e0265598 (18 pp.).
- M. Töpperwien et al., Contrast enhancement for visualizing neuronal cytoarchitecture by propagation-based x-ray phase-contrast tomography, Neuroimage 199, 70 (2019).
In the interaction of X-rays with an atom and in particular with its electron cloud, there is a certain probability that a photon is scattered, i.e. that its trajectory changes. At the X-ray energies typically used for imaging applications, this is an elastic interaction, without loss of photon energy. Small angle X-ray scattering signals arise from this type of interaction. They are related to spatial correlations between scattering centers in a material and provide indirect access to the material organization at the nano and micron length scales.
In conventional tomographic microscopy imaging techniques, the achievable spatial resolution and the accessible field of view are intrinsically related. Imaging systems leveraging on small angle X-ray scattering signals are instead sensitive to microstructures with feature sizes well below the setup intrinsic spatial resolution and in a large field of view. The average microstructure size and orientation in a pixel can be determined without direct access to the microstructure itself, so decoupling the size of the feature of interest from the accessible field of view. Projections with this small angle X-ray scattering information taken for different sample orientations can be tomographically combined to obtain the local scattering tensor in each voxel of the reconstructed volume. This local scattering tensor provides 3D directional information on the local microstructure. This technique has been demonstrated with X-rays and is called small angle X-ray scattering tensor tomography.
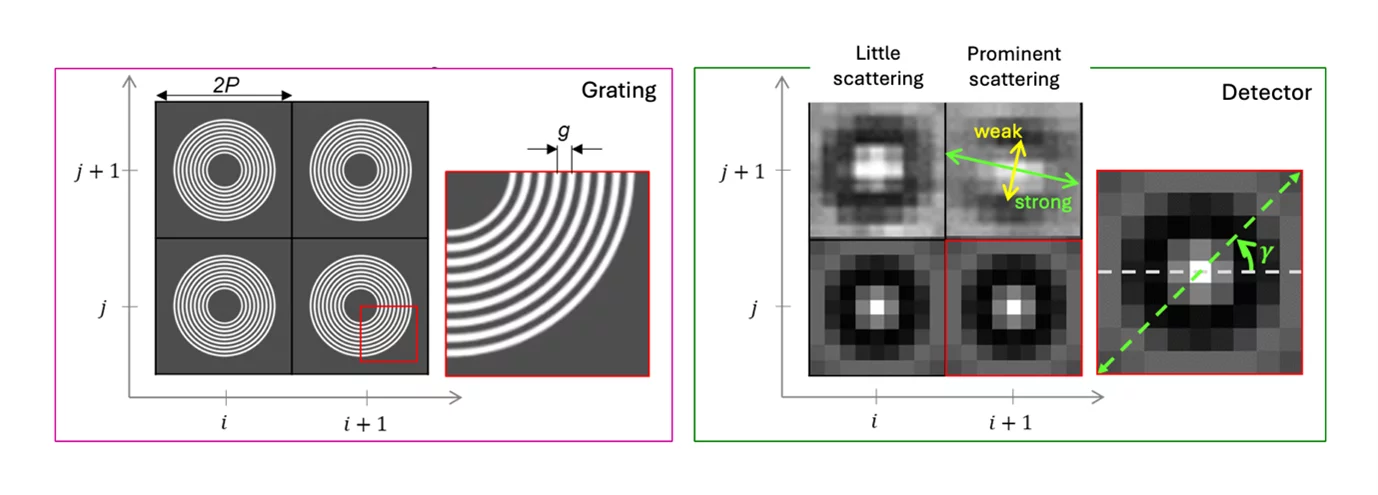
Projections with directional small angle X-ray scattering information can be acquired with different methodologies including scanning approaches with a pencil beam [1], grating interferometry [2] and a single-shot mode using dedicated optical elements with a circular shape and with omni-directional sensitivity [3]. At TOMCAT, we have implemented a setup (Figure 1) based on this latter approach.

The array of circular gratings consists of annular microstructures arranged in unit cells, which form a diffraction pattern at a specific distance downstream where the detector is placed (Figure 2). This pattern is directionally blurred and the fringe visibility reduced by anisotropic structures in the sample. Fourier analysis of the visibility reduction as a function of the angle g provides information on the average scattering intensity, scattering anisotropy and main orientation of the scattering structure [4].
The unknown 3D scattering distribution can be tomographically reconstructed from the information extracted from a set of projections of the sample positioned at different angles and tilts [3, 5]. The 3D scattering distribution in each voxel is approximated by an ellipsoid, under the assumption that within each voxel a single structural orientation is dominant. The eigenvector with the smallest eigenvalue represents the main orientation of the local microstructure. A tensor tomographic reconstruction for a cm-sized industrially relevant freeform injection molding fiber-reinforced composite sample is shown as example in Figure 3.

The omni-directional sensitivity and single-shot approach enabled by the dedicated array of circular gratings unlock time-resolved capabilities in 2D and 3D not available when using scanning techniques. The evolution of carbon fiber reorganization and alignment in a model suspension have for instance been tracked using small angle X-ray scattering tensor radiography and tomography during rheological experiments [7].
References
When irradiated with a hard X-ray beam, materials emit X-ray photons isotropically. This phenomenon is known as X-ray fluorescence (XRF). The energy of these emitted photons is element specific and provides information on the sample composition. If either the incoming or emitted X-ray radiation is shaped by optics, the spatial distribution of different elements in an opaque and bulky object can be reconstructed upon determination of the energy of the detected fluorescence photons.
X-ray fluorescence analyses are traditionally performed with a pencil beam and a time-consuming scanning acquisition scheme, collecting the fluorescence photons with one or more non-position sensitive energy resolved diodes [1]. The achievable spatial resolution is only limited by the size of the used pencil beam, which can be as small as 10s of nanometers [2]. Due to the mechanical movement of the sample through the beam, inevitably rather slow, the investigations are mostly limited to the 2D case or at best, in most cases, to a single tomographic slice.
Full-field XRF imaging, a modality which lifts both beam focusing and sample scanning requirements and therefore has the potential for faster experiments, has been pioneered in the early 2000s [3, 4] using back-illuminated CCD in single photon counting mode. In this configuration, the sample is illuminated with an unfocused millimeter sized beam. Due to the isotropic emission of X-ray fluorescence, additional optics between the sample and the spatially and energy resolved 2D detector following the camera obscura principle is needed (Figure 1). With the high frame rates of hybrid pixel detectors [5-8], the efficiency of this approach has been significantly optimized in recent years [9-13]. The spatially resolved energy information provided by the detector for different angular positions of the sample in the X-ray beam is combined using tomographic reconstruction techniques to obtain hyperspectral 3D images of the investigated sample.
The spatial resolution is limited by the additional optics chosen and is in the order of 10s of microns. The increased flux and brightness available at diffraction limited storage rings like the SLS2.0 have the potential to lift the photon limitation typically associated with XRF applications and make XRF tomography a high throughput and time resolved technique to push multimodal applications and optimally complement structural investigations with elemental information. To fully leverage on these new opportunities, new developments in hybrid pixel detectors and data science methods might though be necessary.
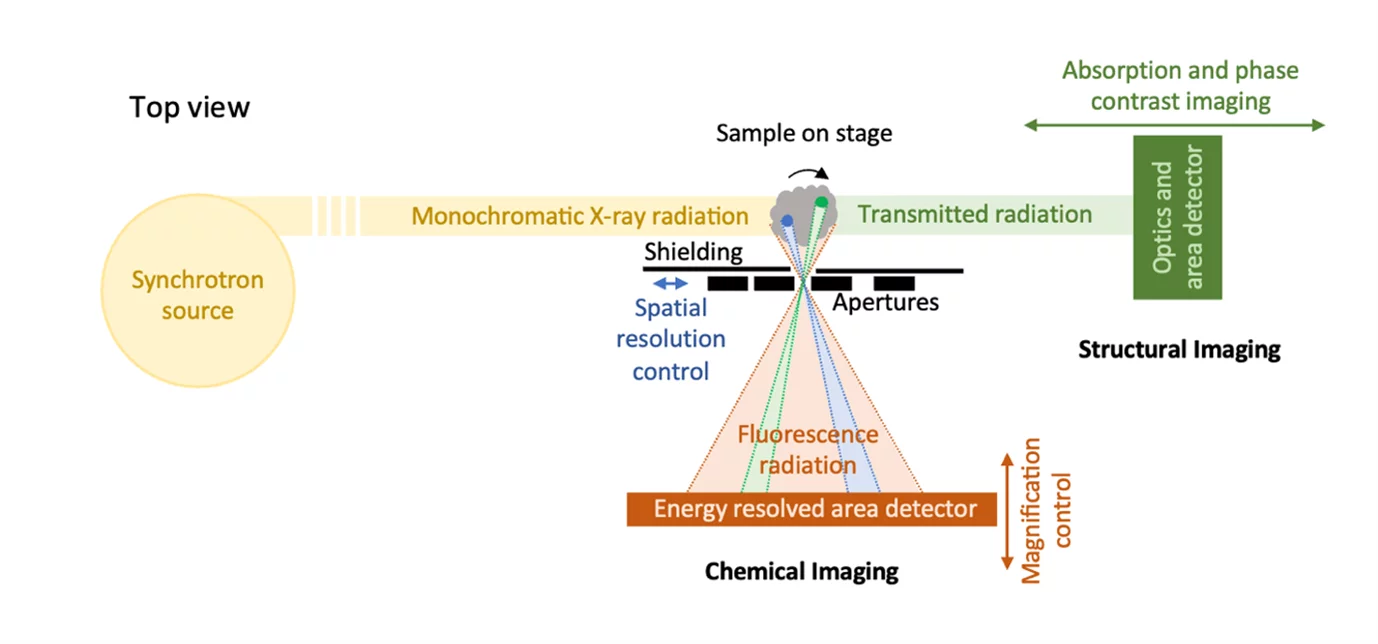
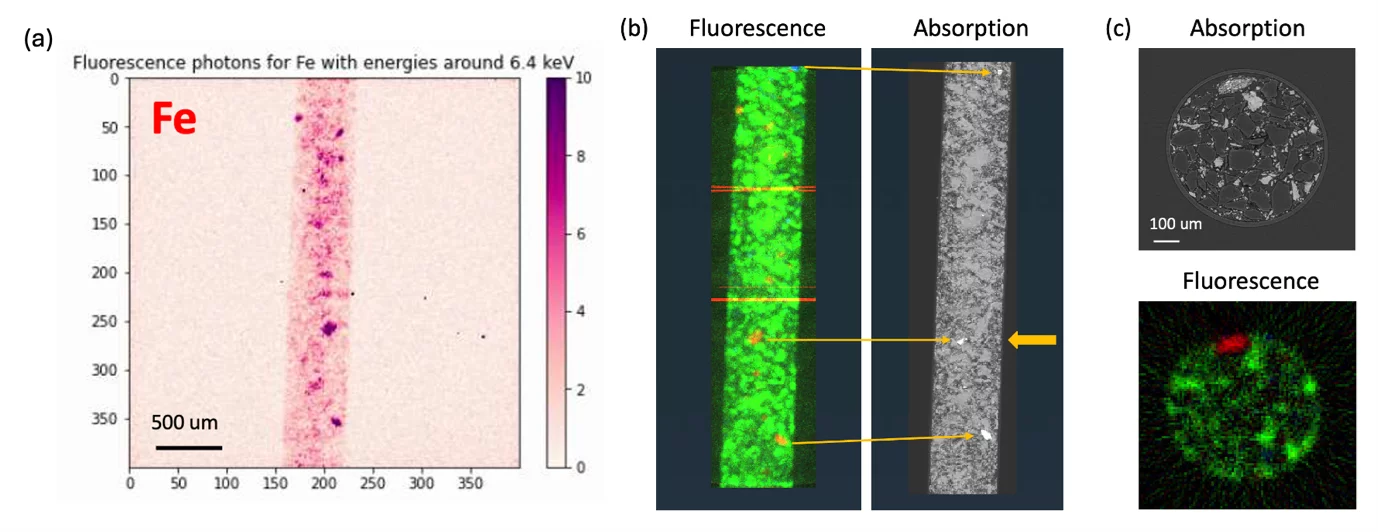
At TOMCAT we have realized a full-field XRF imaging setup, based on the camera obscura principle (Figure 1) and the highly efficient energy resolved area detectors providing high spatial resolution developed at PSI by the Photon Science Detector Group. An example of the measured elemental distribution in a bulky sample in a spatially resolved manner in 3D using the MÖNCH detector [14] and a 25 um pinhole is shown in Figure 2.
References
[1] C. Ryan et al., The Maia detector array and x-ray fluorescence imaging system: locating rare precious metal phases in complex samples, SPIE Proceedings Volume 8851, X-Ray Nanoimaging: Instruments and Methods; 88510Q 2013.
[2] T. W. Victor et al., Scientific Reports, 2018, 8, 13415.
[3] A. Sasov et al., A compact MicroCT/MicroXRF scanner for non-destructive 3D chemical analysis, SPIE Proceedings Volume 7078, Developments in X-Ray Tomography VI; 70780R (2008)
[4] M. Alfeld et al., AIP Conference Proceedings, 2010, 1221, 111-118.
[5] F. Van Assche et al., Journal of Instrumentation, 2018, 13, C11015.
[6] M. C. Veale, et al., Synchrotron Radiation News, 2018, 31, 28-32.
[7] M. Khalil, et al., J. Synchrot. Radiat., 2018, 25, 1650-1657.
[8] S. Cartier et al., Journal of Instrumentation, 2014, 9, C05027.
[9] O. Scharf et al., Analytical Chemistry, 2011, 83, 2532-2538.
[10] B. De Samber et al., Journal of Analytical Atomic Spectrometry, 2019, 34, 2083-2093.
[11] S. D. M. Jacques, et al., Analyst, 2013, 138, 755-759.
[12] J. Žemlička, et al., Nucl. Instrum. Methods Phys. Res. A., 2009, 607, 202-204.
[13] F. D. Leite et al., Spectrochimica Acta Part B: Atomic Spectroscopy, 2022, 198, 106545.
[14] R. Dinapoli et al., Journal of Instrumentation, 2014, 9, C05015