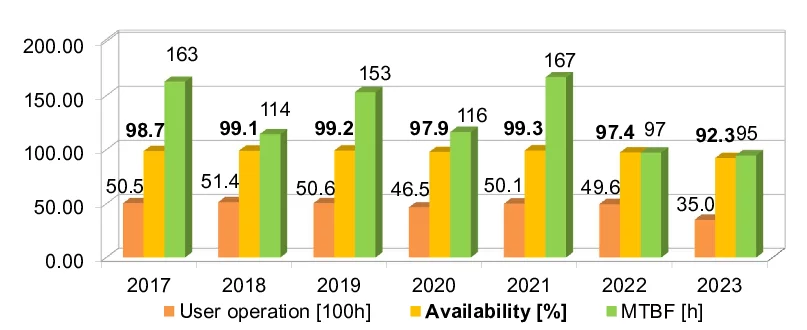
The following picture shows the main figures of the operation statistics for the SLS. More detailed information can be found in the yearly operation reports.
Here are our definitions:
- Downtime: time between beam loss (Ibeam < 20mA) and full recovery (Ibeam >= Inominal = 400 mA).
- Short-uptime-rule: if two beam outages have less than 1 hour of uptime in between, it is counted as one long downtime.
- Scheduled-user-time: this time is distributed between the accepted user proposals
- Scheduled-user-reserve-time: additional user time, provided to compensate beam outages (introduced 2004)
- User-Time: Scheduled-user-time + Scheduled-user-reserve-time
- Delivered-beam-time: User-Time - Downtime
- Total-downtime: Sum over all individual Downtime of one year
- Number-of-faults: Count of all individual Downtimes
- Number-of-distortion = Incidence count of Downtimes, beam drops and orbit feedback failures
- Availability: Delivered-beam-time / User-Time.
- Availability after compensation: Delivered-beam-time / Scheduled-user-time.
- MTBF: Mean Time Between Failures = User-Time / (Number-of-faults + 1)
- MTTR: Mean Time To Recover = Total-downtime / Number-of-faults
- MTBD: Mean Time Between Distortions = User Time / Number-of-distortion
The tables below show the detailed statistics for the operation of the SLS in the past years.
| Beam Time Statistics | 2016 | 2017 | 2018 | 2019 | 2020 | 2021 | 2022 | 2023 | ||||||||
|---|---|---|---|---|---|---|---|---|---|---|---|---|---|---|---|---|
| Swiss Light Source | [h] | [%] | [h] | [%] | [h] | [%] | [h] | [%] | [h] | [%] | [h] | [%] | [h] | [%] | [h] | [%] |
| o total beam time | 6864 | 78.1 | 6784 | 77.4 | 6824 | 77.9 | 6736 | 76.9 | 6336 | 72.1 | 6688 | 76.3 | 6512 | 74.3 | 4872 | 55.6 |
| + user operation | 5016 | 57.1 | 5048 | 57.6 | 5144 | 58.7 | 5056 | 57.7 | 4672 | 53.2 | 5008 | 57.2 | 4960 | 56.6 | 3504 | 40.0 |
| - incl. compensation time | 160 | 1.8 | 184 | 2.1 | 160 | 1.8 | 160 | 1.8 | 144 | 1.6 | 144 | 1.6 | 96 | 1.1 | 72 | 0.8 |
| + beamline commissioning | 800 | 9.1 | 792 | 9.0 | 840 | 9.6 | 760 | 8.7 | 760 | 8.7 | 728 | 8.3 | 744 | 8.5 | 448 | 5.1 |
| + setup & beam development | 1048 | 11.9 | 944 | 10.8 | 840 | 9.6 | 920 | 10.5 | 904 | 10.3 | 952 | 10.9 | 680 | 7.6 | 920 | 10.5 |
| o shutdown | 1920 | 21.9 | 1976 | 22.9 | 1936 | 22.1 | 2024 | 23.1 | 2448 | 27.9 | 2072 | 23.7 | 2248 | 25.7 | 3888 | 44.4 |
| o downtimes at user operation | 25 | 30 | 44 | 32 | 39 | 29 | 50 | 36 | ||||||||
| + unscheduled outage | 45 h | 0.9% | 63 h | 1.3% | 49 h | 0.9% | 42 h | 0.8% | 96 h | 2.1% | 37 h | 0.7% | 127.6 h | 2.6% | 270 h | 8.0% |
| + injector outage (non top-up) | 1 h | 0.0% | 1 h | 0.0% | 3 h | 0.1% | 6 h | 0.1% | 26 h | 0.6% | 17 h | 0.3% | 13 | 0.2% | 11 h | 0.3% |
| Total beam integral | 2497 Ah | 2528 Ah | 2560 Ah | 2512 Ah | 2315 Ah | 2472 Ah | 2373 Ah | 1570 Ah | ||||||||
| Availability | 99.1% | 98.7% | 99.1% | 99.2% | 98.0% | 99.3% | 97.4% | 92.3% | ||||||||
| Availability after Compensation | 102.4% | 102.5% | 102.2% | 102.4% | 101.1% | 102.2% | 99.3% | 94.7% | ||||||||
| MTBF | 193.0 h | 162.8 h | 114.3 h | 153.2 h | 116.3 h | 166.9 h | 97.3 h | 91.6 h | ||||||||
| MTTR | 1.8 h | 2.1 h | 1.1 h | 1.3 h | 2.5 h | 1.3 h | 2.6 h | 7.5 h | ||||||||
| MTBD | 67 h | 42 h | 59 h | 31 h | 26 h | 36 h | 27 h | 19 h | ||||||||
