


Time-series analysis methods are commonly used in many research areas for extracting useful information related to the structure and the characteristics of the analysed system. Inferring the underlying interconnections between signals of complex systems such as the human brain, social networks, stock markets, etc., is a challenging and complicated task. Similar developments and applications of time-series analysis techniques for monitoring and diagnostics of the nuclear reactors’ operation continue to be a hot topic of research. The so-called causality analysis is commonly used in various research fields for identifying the cause-and-effect relationships between signals within multivariate and complex models. This work summarizes a systematic approach for applying the causality analysis technique, for the first time, on nuclear reactor systems. To this aim, the most prominent causality measures have been implemented in the PSI signal analysis methodology and both simulated and measured plant data have been analysed. Results show that, the current analysis is able to identify accurately the importance and the central role of the activation signal when it is applied on a simple analytical mode. In addition, the application on a more realistic and complex measured data set of a Swiss boiling water reactor (BWR), illustrates the capability of this analysis to indicate possible causes behind the noticed anomalies or trends observed at certain conditions, and more importantly, allows a better understanding of the underling interactions among different neutronic and thermal-hydraulic processes.
Methodology: From raw noisy data to signals’ connectivity patterns
The PSI connectivity analysis methodology is fully developed in the MATLAB environment and has been, appropriately, adjusted in order to analyse efficiently and in a user-friendly manner either simulated or measured nuclear reactor data. The flow chart of the PSI connectivity analysis methodology is summarized in Fig. 1.

This methodology consists of a set of MATLAB scripts, comprising basic signal analysis functionalities and advanced causality analysis techniques. The PSI connectivity toolbox is divided in two main parts, i.e. the time- and the frequency-domain analysis parts. First, any data set (composed of simulated or measured raw data) is imported in the toolbox in an EXCEL/MATLAB matrix or in ASCII format. The input data corresponds to a set of simultaneously recorded time signals of various parameters (e.g. in/ex-core neutron detector responses, coolant temperature and flow responses, valves’ opening positions, etc.). These signals are analysed in a preliminary stage (i.e. data post-processing) in order to extract the first indications about their quality. To this aim, the raw data are screened in the time-domain and any erroneous or faulty recorded signals are identified and removed from the further stages of the analysis, since they will disturb the causality analysis functionality. In addition, key statistical quantities are estimated for each time signal (e.g. mean value, standard deviation, noise to signal ratio, etc.), and therefore, a preliminary identification of the data set’s structure is achieved.
Next, a Multi-Variate Autoregressive (MVAR) model is fitted to the multi-variate set of input signals. This is a key step of the connectivity analysis methodology, since all the causality measures will be estimated based on the model coefficients, to be evaluated at this stage. The fitting process requires the evaluation of the optimal model order and the estimation of an appropriate fitting algorithm, ensuring the best possible fitting approach and consequently avoiding any over- or under-fitting. Various algorithms (such as the Bayesian Information Criterion, the Akaike Information Criterion, the Final Prediction Error Criterion, and the Hannan-Quinn Criterion) have been implemented in the PSI connectivity toolbox, and the criterion that is associated with the minimum model order is further used in the connectivity analysis. In addition, the Vieira-Morf, Nuttel-Strand, Least-Square Estimation and ARfit algorithms for the MVAR fitting of the analysed data-set are all available in the PSI toolbox. After that, the estimated MVAR model coefficients are transformed in the frequency domain, and the most prominent causality analysis estimators are evaluated. These are: the renormalized partial directed coherence (rPDC), and the directed transfer function (DTF). The rPDC indicates the direct interconnections between the analysed signals, whereas, the DTF reflects how the signals are driven from an activation source.
Finally, the connectivity analysis results are summarized using the so-called connectivity graphs, following the principles of the graph theory. The connectivity graphs are used not only for the visualization of the connectivity analysis results, but also for estimating the topological characteristics which offer a further understanding of the signals’ significance within the analysed system.
Application on real BWR data
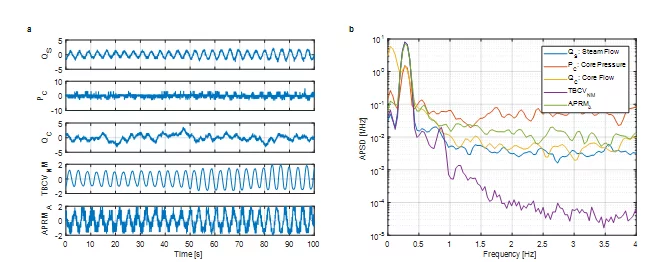
To illustrate the capabilities of this approach, the PSI connectivtiy analysis methodology is applied on real plant data originating from the Swiss Leibstadt nucelar reactor (KKL). The analyzed data set corresponds to low power (18.8 %) and low coolant flow rate (33.5 %) conditions, during the generator synchronization. The systematic analysis of the plant data by using the PSI stability methodology revealed high decay ratios (i.e. DR=0.6 – 0.9), at the very low resonance frequency of 0.27 Hz for most of the in-core neutron detectors. It is well known in stability analysis, however, that at such low core power/flow levels, the reactor core is expected to be very stable, and therefore, the source of such high decay ratios is intended to be estimated via connectivity analysis. The extended statistical and post-processing analysis of the measured data in both the time- and frequency-domain revealed which signals are exhibiting a distinct oscillatory behavior during this measurement. Fig. 2 presents the time- and frequency-dependent behavior of these reactor signals: steam flow (QS), core pressure (PC), core coolant flow (QC), turbine bypass control valve (TBCVNM) and average power range monitor (APRMA). All signals have a sampling frequency of 8 Hz and have been recorded over 100 sec. These signals, and in particular the QS, PC, and TBCVNM, exhibit a clear oscillatory behavior at the resonance frequency of 0.27 Hz, with an almost noise-free response (nearly pure sine wave) of the opening position of the turbine bypass control valve TBCVNM.
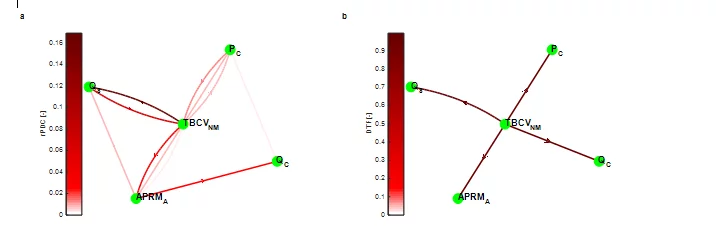
For this example, the MVAR model order is estimated by the Bayesian Information Criterion (p=6). Then a MVAR model based on the Nutall-Strand algoritm is fitted to the simulated data for estimating the model coefficients. The rPDC and DTF causality measures are estimated based on the trasnsformed MVAR model coefficients and their results are summarized in the network graphs, in Fig. 3. The TBCVNM signal clearly drives the response of both the steam flow and the neutron signal, based on the rPDC analysis. In addition, the bypass control valve fluctuation is evidently propagating throughout the entire system, based on the DTF analysis, indicating its essential impact during the synchronization of the generator. The key role of the TBCV can be explained by the fact that throughout the generator synchronization the turbine control valves (TCVs) are only partially open as the steam is dumped to the condenser. During the analyzed operation stage, the opening positions of the TBCVs are adjusted based on the steam dome pressure control system until the generator is synchronized and the steam is directed to the TCVs. Therefore, when the steam dome pressure exceeds certain limits then the TBCVs positions are opening and vice‐versa (this is why an interconnection is observed from PC to TBCV in Fig. 3a). Consequently, the TBCVs exhibit the oscillatory behavior, as depicted in Fig. 2a, and interfere with all the other reactor processes, as the connectivity networks indicate in Fig. 3.
The results of this example clearly show the central role of the bypass control valves in affecting the reactor system, through the estimation of the rPDC and DTF measures. It can be concluded therefore that, the PSI connectivity analysis has been successfully applied, for the first time, in the nuclear reactor field, and has led to a comprehensive study allowing the identification of the relationships between different processes, and more importantly, estimating the causes triggering certain disturbances or anomalies in nuclear reactors.
The interested reader can refer to the original publication for acquiring more information and details of the performed research.
Contact
Dr. Alexander Vasiliev
Steady-State, Transient and Radiation Safety Analyses - System Group (STARS)
Laboratory for Reactor Physics and Thermal-Hydraulics (LRT)
Nuclear Energy and Safety Research Division (NES)
Paul Scherrer Institut
Original Publications
Application of Causality Analysis on Nuclear Reactor Systems
D. Chionis, A. Dokhane, H. Ferroukhi, and A. Pautz
Chaos 29, 043126 (2019); doi: 10.1063/1.5083905