
Accidents in the energy sector often affect people’s health and property, the supply of economic goods and services, and degrade ecosystems and their functions. Thus, the protection of critical infrastructure facilities in the energy sector is of paramount importance. A sufficient and continuous energy supply forms the backbone of our modern society and many of its products, which in turn rely on interrelated and interdependent information and communication technologies. For this purpose, the PSI’s Technology Assessment group has developed a comprehensive and integrated framework for comparative accident risk assessment of energy systems (Figure 1) since the late 1990s.
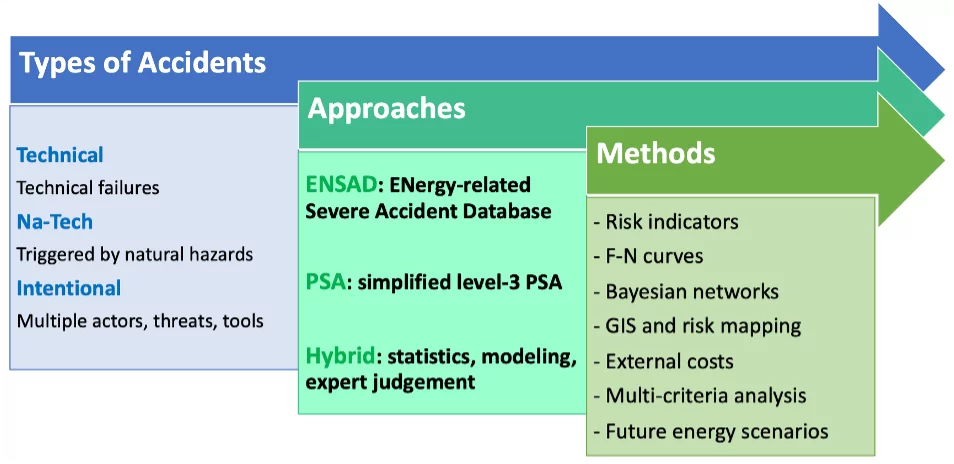
The so-called ENergy-related Severe Accident Database (ENSAD) is the core component of this activity because assessments build upon historical experience whenever possible (e.g., for fossil energy chains, hydropower, etc.). In contrast, a simplified probabilistic safety assessment (PSA) is applied for nuclear, and evaluations of new renewables are based on a hybrid approach combining available data, modeling, and expert judgment. ENSAD provides a comprehensive, worldwide coverage of energy-related accidents. In the data collection process a multitude of primary information sources are surveyed, and their contents are verified, harmonized and merged. The initial scope of the database was limited to technological accidents, but more recently also accidents triggered by natural hazards were included. Within the Future Resilient Systems (FRS) program of the Singapore ETH Centre (SEC), a new version, the so-called ENSAD v2.0 was developed, which is based upon an interactive, web-based GIS database and uses state-of-the-art, open source technology. Furthermore, the ENSAD Visual Explorer (EVE) provides a publicly available version with access to all accidents, but only selected data fields can be viewed. Lastly, Intentional attacks on energy infrastructures including terrorist threat have been collected in a separate database. For this purpose, the Energy Infrastructure Attack Database (EIAD) was developed, which is a collaboration between PSI, the Center for Security Studies at ETH Zürich, and the Energy Policy Institute at the University of Chicago (EPIC) building upon PSI’s experience with ENSAD.
The comparative risk assessment of energy accidents has also progressed in terms of methodological developments and novel case study applications. Examples include, among others:
- use of advanced analytical approaches such as Bayesian statistics, machine learning techniques and operational research;
- integration with Geographic Information Systems (GIS) to calculate location-specific risk indicators;
- evaluation of risk indicators within Multi-Criteria Decision Analysis (MCDA);
- calculation of external costs for electricity and mobility technologies;
- estimation of risk indicators for integration in future energy scenarios.