The OECD-NEA Benchmark Study of the Accident at the Fukushima Daiichi Nuclear Power Station (BSAF) is aimed to evaluate and analyse the accident progression, likely end-state of the reactor core after the accidents, and the source term to the environment. PSI has successfully participated in the project concentrating on the analysis of unit 3 using MELCOR2.1. Hundreds of sensitivity calculations have been performed in order to obtain a plausible scenario. The selected sequence for 15 days after scram predicted remarkably well the main signatures, namely pressure in the reactor vessel and containment, as well as the water level in the reactor vessel. The detailed plausible scenario is described below.
Plausible accident scenario
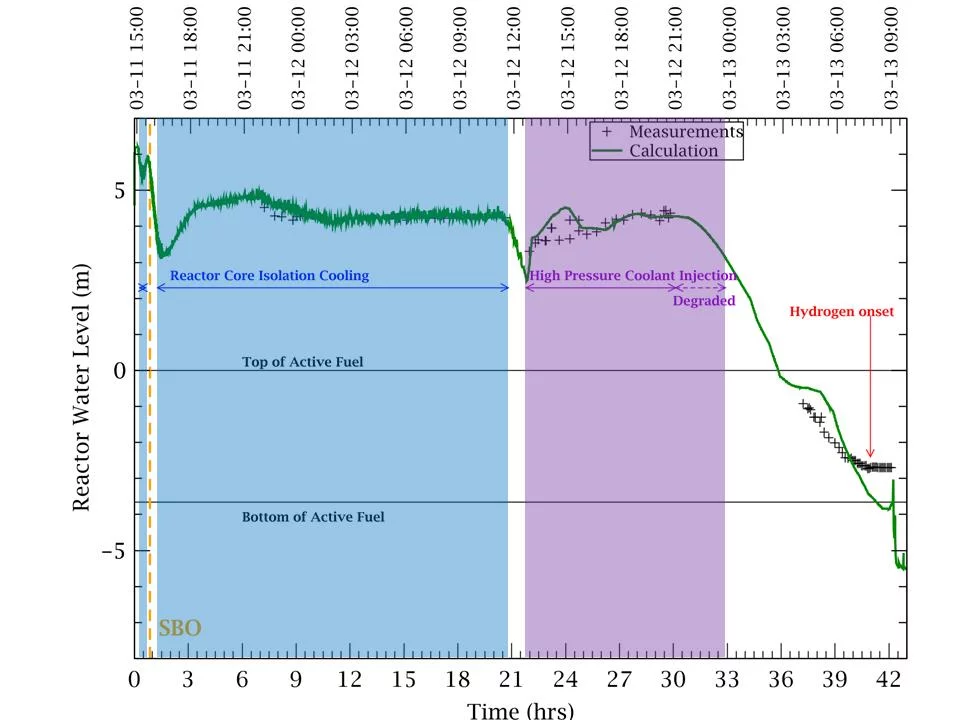
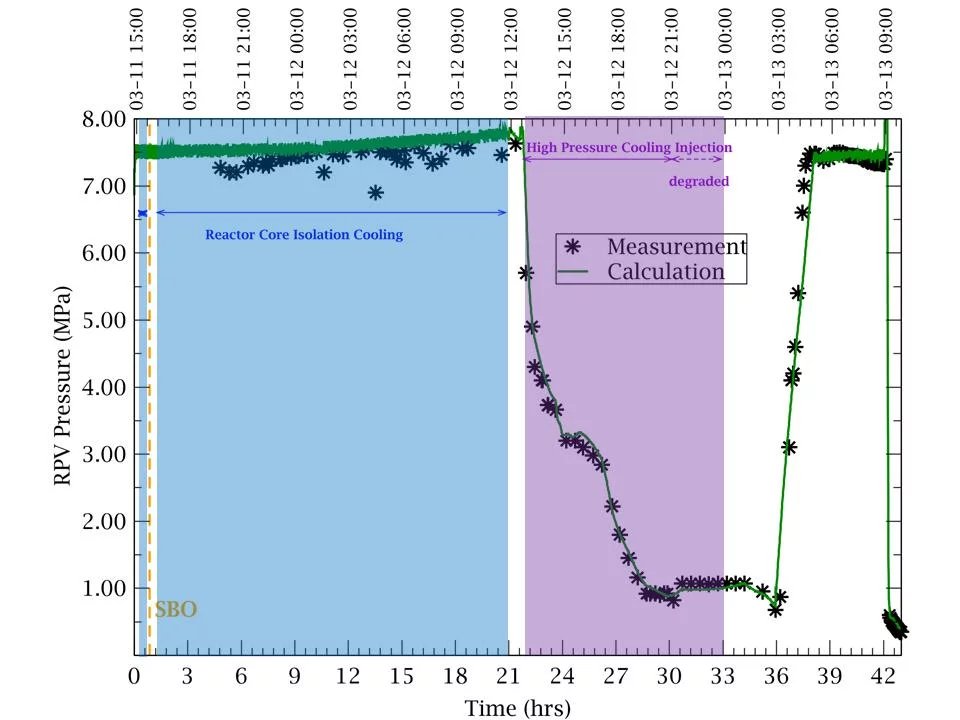
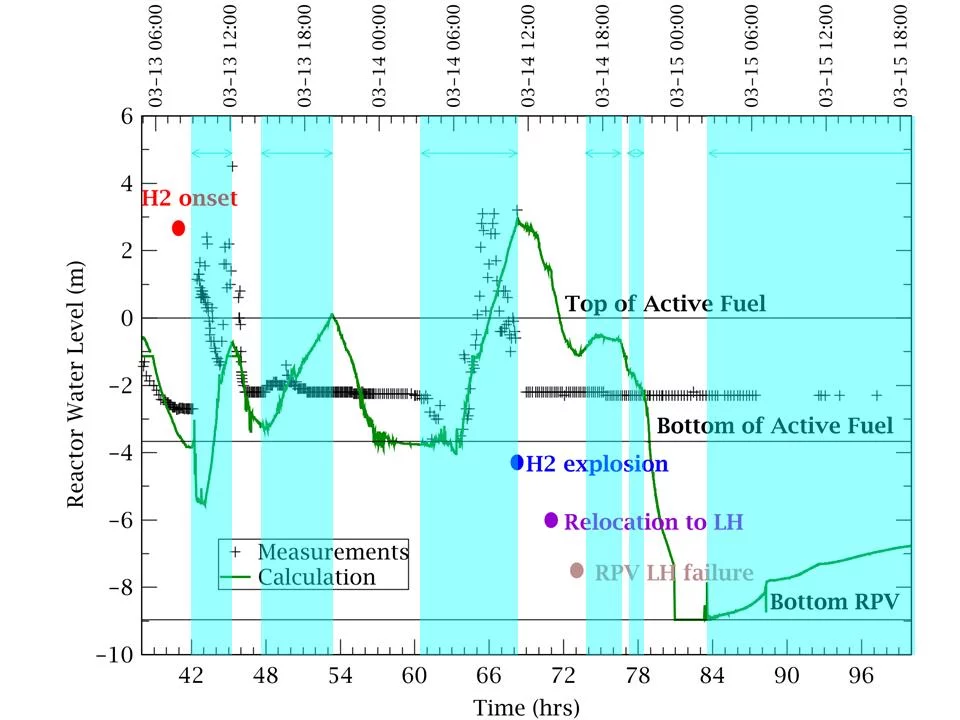
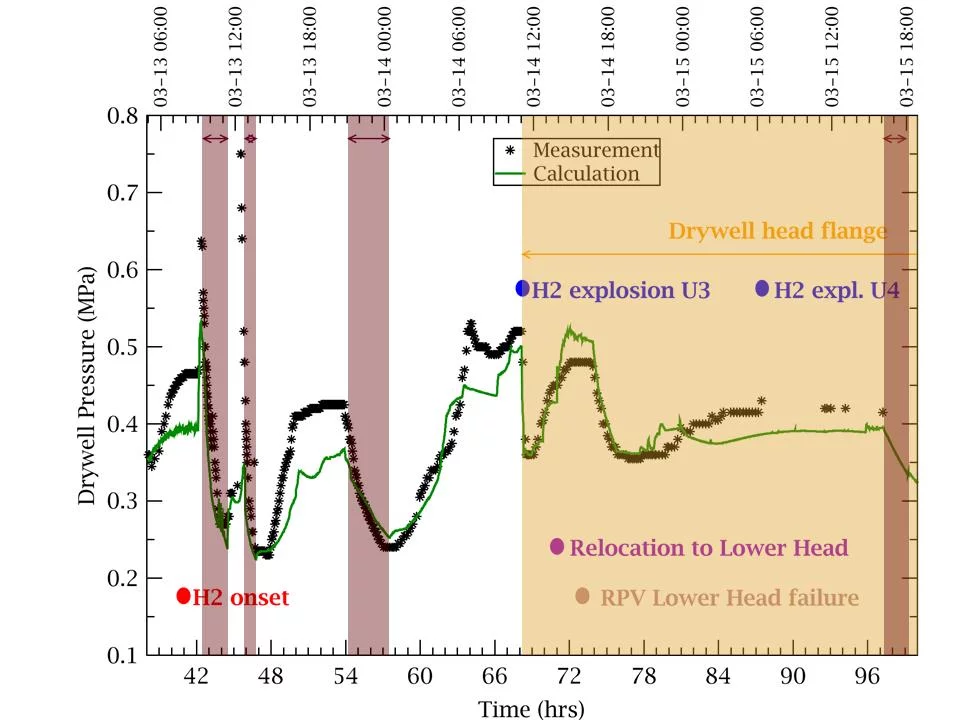
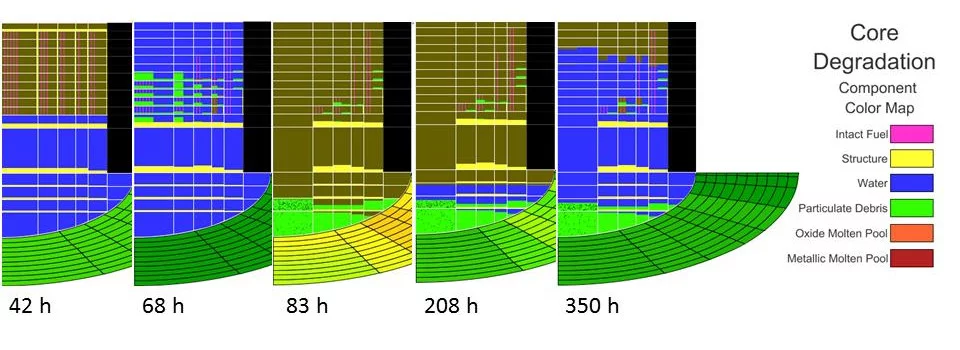
Fukushima Unit 3 transient started on March 11th 2011 at 14:47 when the reactor SCRAMmed as a response to the earthquake. This is considered the time 0:00 h. At ca. 0:58 h the arrival of the Tsunami caused a station black out (SBO). During the first hours of the accident the Reactor Core Isolation Cooling (RCIC) and the High Pressure Coolant Injection (HPCI) were available and cooling the reactor core (i.e. except between 0:38-1:16 h and 20:49-21:48 h). Using these systems, the reactor water level could be maintained at almost nominal level for 30 hours after reactor shut-down, figure 1. Pressure was maintained during RCIC operation with the cycling Safety relief valves (SRV). During HPCI operation pressure dropped as a combination of steam being extracted from the reactor vessel and larger amount of water being injected to the reactor vessel, figure 2. Towards the end of HPCI operation water injection started to degrade due to low reactor pressure. The start of core degradation was shown by onset of hydrogen generation by cladding oxidation at ca. 41 h. Reactor depressurisation took place at ca. 42 h followed by several alternative water injections (i.e. marked in magenta) and venting actions (i.e. marked in maroon) performed by the operators, Figure 3 and 4, respectively. Several dry-out events and subsequent reflood actions took place between 42 and 350 hours. Figure 5 shows the evolution of the core degradation as calculated by MELCOR. The intact rods are represented in pink and the debris are represented in green. A hydrogen explosion occurred in Unit 3 on March 14 at 11:15. Shortly before the explosion in unit 3 the core has suffered major relocation of rods which have formed debris. The debris were collected on the support plate. The core support plate was estimated to have failed at 70 h causing relocation of debris to the lower head. Penetration failure of the pressure vessel lower head was estimated at 73 h causing only water leakage out of the reactor. At ca. 82 h 15% of the debris was predicted to be discharged to the pedestal, but the water present in the cavity prevented the onset of molten core concrete interaction (MCCI).
Sensitivity studies and limitations in the modelling
The time when lower head failure and subsequent relocation of corium to the pedestal took place is uncertain. The existing studies made by several institutions vary in a range from 42 – 80 h. At PSI we have performed several calculations exploring the different failure time possibilities. The results of our analysis showed that in case failure was predicted at 42 h the rest of the transient could not be reproduced. Therefore we have selected a transient that predicts the best the majority of the signatures. Nonetheless, it is possible that during the accident, major core relocation to the lower head took place earlier than in the selected scenario, shortly before the hydrogen explosion in unit 3, at ca. 68 h. This may have also produced a penetration in the lower head to fail and it may have been the trigger to the drywell head flange overpressure failure shortly before the hydrogen explosion. This possibility is currently being explored. The amount of debris that was relocated to the pedestal is another main uncertainty. Recent inspections made by TEPCO with a Remotely Operated Vehicle (ROV) showed that there are refrozen debris and lumps of melt at different locations inside the pedestal, but the bottom of the lower head is visible, indicating that there was not a global failure of the RPV lower head. Several leakage points have been identified. The onset of molten core-concrete interaction (MCCI) and possible arrest is very uncertain. Two factors make the prediction very challenging. First, it seems that the melt was not expelled from the RPV in one single event but rather as a progressive relocation over the course of several hours. In addition there is the possibility that water was present in unit 3 pedestal at the time of the RPV failure. This makes the prediction extremely challenging as research of MCCI in the presence of water is limited.
Fission Product release
Approximately 0.1% of Cs-137 and 0.2% of I-131 were released to the atmosphere according to our analysis. The main releases took place during venting of the containment. The releases were limited due to scrubbing of the fission products in the water in the wetwell after being released to the containment from the reactor vessel by safety relief valves. The release values agree very well with the estimates based on environmental measurements of the activity release during the main release events from unit 3 (Katata et al., 2015) as shown in table 1. Additionally, ca. 10% i.i. of iodine was estimated to be present in the water in the drywell of the containment and ca. 11% to have been transported with the contaminated water to the reactor building in the late phase of the accident. This estimation seems to be in agreement with the estimation of 26% i.i. of iodine in the water in the reactor and auxiliary buildings made by Hidaka and Ishikawa (2014), noting that Hidaka and Ishikawa data are from the end of April 2011.
Considerations in the modelling of the fission products
The estimates of the activity release from Katata et al (2015) have not enough resolution to show the shape of the individual releases. The estimations are based on land and sea measurements over long periods of time and the estimated releases are continuous. Therefore, it is uncertain which integral value should be compared against the main releases with the MELCOR predictions. Iodine was represented in the MELCOR model only as CsI compound. Therefore it was released from fuel as aerosol and a large fraction was retained in the suppression chamber (59% from i. i.). However, it is possible that a part of it was present as gas phase iodine (I2 and organic iodides) which could have been released to the atmosphere during the containment vents. The iodine present in the contaminated water in the late phase of the accident represents an additional source of iodine that could have been released to the atmosphere as gaseous iodine. These releases are neglected in MELCOR 2.1 as no iodine chemistry is included in the modelling.
| Releases | ||
|---|---|---|
| Total 1st, 2nd and 3rd vent | 4.69 | 5.15 |
| U3 hydrogen explosion | 0.27 | 2.0 |
| Total releases during the accident | - | 150.2 |
Contact
Dr. Detlef Suckow
Severe ACcident REsearch group (SACRE)
Laboratory for Reactor Physics and Thermal-Hydraulics (LRT)
Nuclear Energy and Safety Research Division (NES)
Paul Scherrer Institut
Original Publications
Analysis of the accident in the Fukushima Daiichi nuclear power station Unit 3 with MELCOR_2.1
L. Fernandez-Moguel and J. Birchley
Annals of Nuclear Energy 83, 193–215 (2015)
DOI: 10.1016/j.anucene.2015.04.021
Benchmark Study of the Accident at the Fukushima Daiichi NPS: Best-Estimate Case Comparison
M. Pellegrini, K. Dolganov, L. E. Herranz, H. Bonneville, D. Luxat, M. Sonnenkalb, J. Ishikawa, J. H. Song, R. O. Gauntt, L. Fernandez Moguel, F. Payot, and Y. Nishi
Nuclear Technology 196, 198–210 (2016)
DOI: 10.13182/NT16-63


