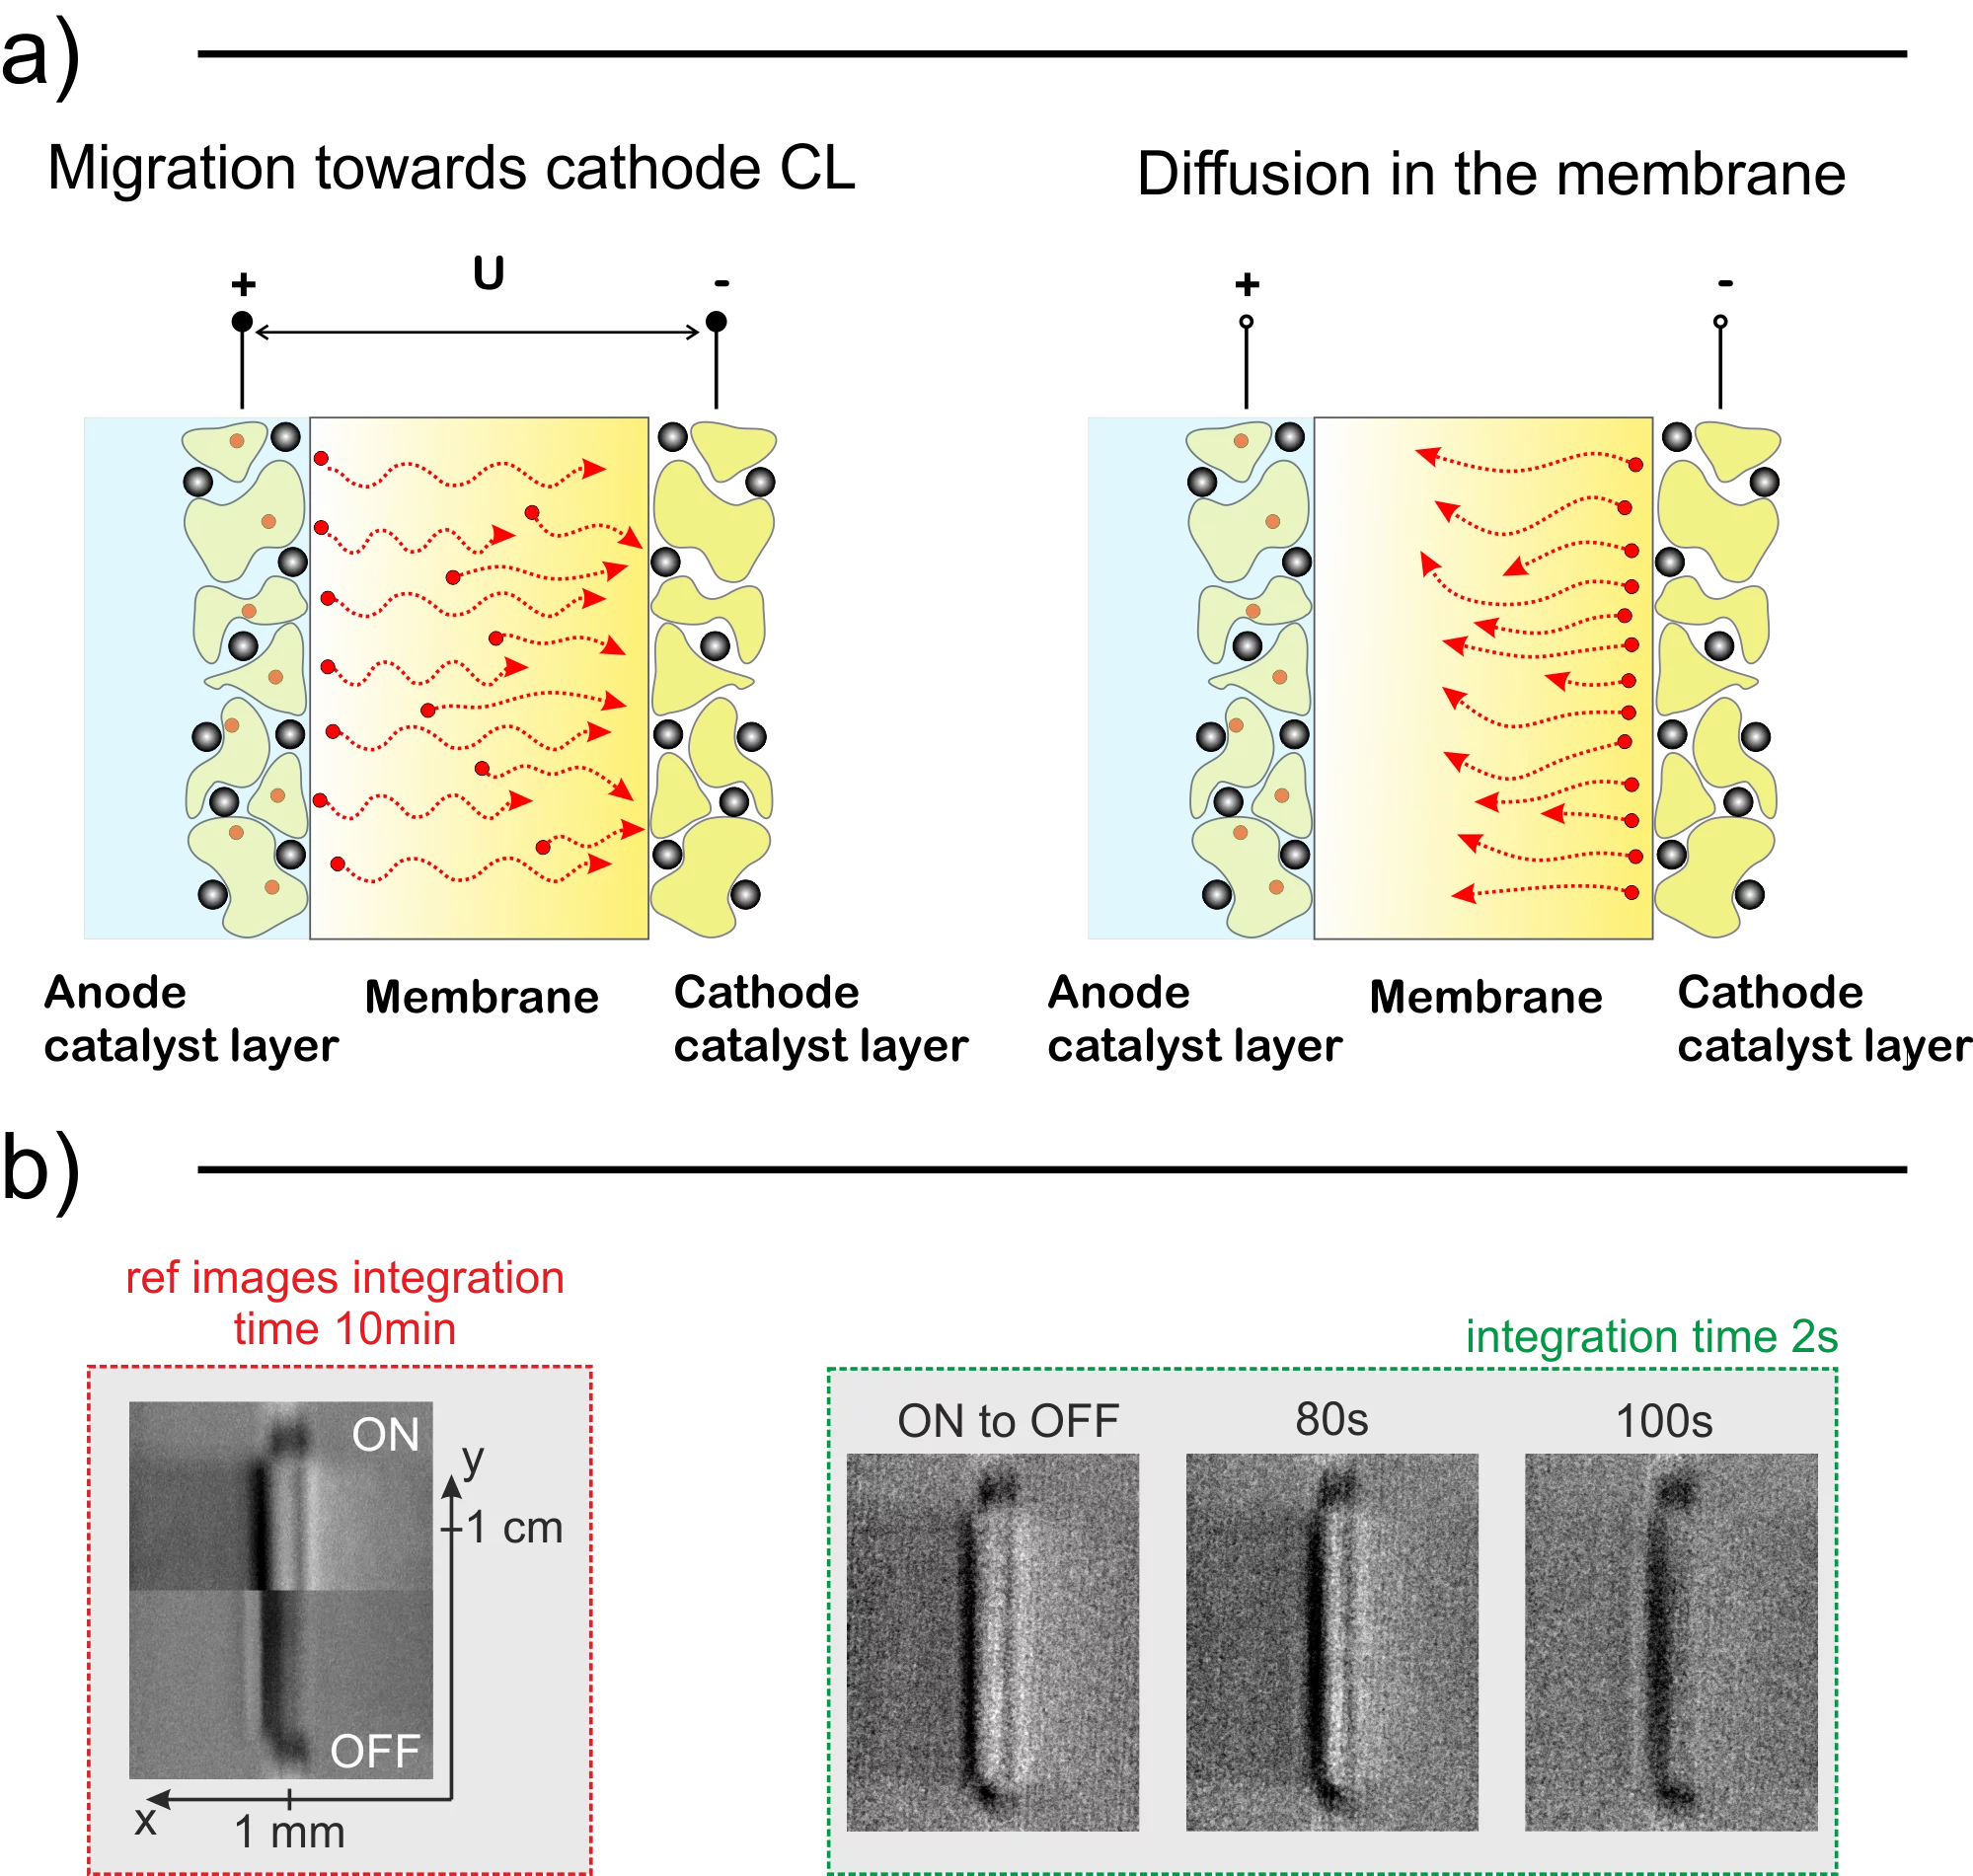
With the help of in situ PEWE regeneration methods, we can potentially enable the treatment of degraded cells without the necessity of stack disassembly, saving operation costs of the plant. In this context, we observed the movement of cations in a PEWE cell using neutron imaging and compared it with a model. This model is expected to be useful for the early detection of cation contamination problems in PEWEs, and the monitoring of in situ regeneration.
We are experiencing rapid changes in the energy sector towards green sources and hydrogen technologies are at the verge of a breakthrough. The hydrogen, however, has to be produced using emission-free devices such as polymer electrolyte water electrolyzers (PEWE) if we are planning to become truly environment friendly. For large scale use, this clean technology has to be economically viable, which is why it is necessary to bring operation and capital costs further down. One of the ways to reduce the operating costs is to prolong the lifetime of the PEWE stack by mitigating the deterioration. Among many degradation factors, the contamination caused by cationic impurities in feed water is a major problem in (PEWE). The good news is that this type of damage is reversible and we believe that our efforts can enable easy diagnostics and the regeneration without the need to disassemble the electrolyzer stack. Using neutron radiography and electrochemical characterization techniques, we found that the contaminants have a different impact on the cell depending on their position across the catalyst-coated membrane (CCM). To obtain a fundamental understanding of why and how this happens we performed multiple neutron imaging experiments using Gd3+ as a model contaminant due to its high neutron cross-section and developed a model, which was tuned using experimental data. It is common knowledge that two main forces govern the dynamics of ionic movement and positioning in the eletrolyser membrane. The diffusion, which is driven by the ion concentration gradient and the migration, which is driven by the electric field acting on charged particles during the cell operation. The cation distribution in the CCM depends on the equilibrium between these two forces. We performed steady-state measurements to measure the absolute amount of contaminants in the membrane as well as to observe the final ionic distribution during operation and standby of the electrolyzer. In the next step, we measured transients to obtain time constants between the steady states, which allowed us to calculate the transport properties of Gadolinium ion in the membrane. Coupling these measurements with electrochemical analysis, we obtained conclusive results. We found that that upon startup of the contaminated PEWE cell, which was on standby for an extended period one, could expect exceptionally high voltage peak, which quickly decays. The voltage and membrane conductivity quickly recovers as the cations migrate to the neighborhood of the cathodic catalyst layer (CL). It takes around 10 seconds for the cations to accumulate in the cathode CL and over 10 minutes to diffuse back to the bulk of the membrane after shutdown. Using data from quantified neutron images and electrochemical overpotential breakdown analysis, we found that even very small amount of cations can severely degrade the cell. The fraction of occupied exchange groups (2.5 %) does not match the membrane resistance increase (10%) increase. The reason behind this higher than expected impact most likely stems from additional yet unknown mechanisms (e.g. polymer morphology alteration). Since the membrane resistance is affected only by the cations remaining in the bulk of the membrane, we performed cyclic current density ramp up and down measurements to confirm that the amount of the cations in the membrane will follow the membrane resistance values. We observed a very good agreement between the two and concluded that performing polarization curve measurements cyclically can be a good way to check for ionic presence in the membrane – identifies as a hysteresis between the up and down current sweeps. As the next step, we developed a model, which predicts the distribution and movement of these ions. We tuned and validated the model using our neutron imaging data. The model was later set-up to simulate the cell contaminated with Fe3+ to simulate the cyclic polarization curve measurement, which was measured using a different PEWE cell. Once again, we found good agreement between the simulation and experiments confirming the method effectiveness. The article also discusses the transport properties of ions in the membrane and provides values for diffusion and migration coefficients of Gd3+ ions in Nafion based membranes. We invite you to read the full article to get more in-depth information on cationic contamination of PEWE systems.
Contact
Dr. Pierre Boillat
Head of Neutron Imaging of Electrochemical Systems Group
Paul Scherrer Institut
5232 Villigen PSI
Switzerland
Telephone: +41 56 310 27 43
E-mail: pierre.boillat@psi.ch
Original Publication
Dynamic Neutron Imaging and Modeling of Cationic Impurities in Polymer Electrolyte Water Electrolyzer
M. Zlobinski, U. Babic, M. Fikry, L. Gubler, T.J. Schmidt, P. Boillat
J. Electrochem. Soc. 167, 144509 (2020)
DOI: 10.1149/1945-7111/abc83b
Acknowledgement to Funding Agency
Financial support from the Swiss Federal Office of Energy (SFOE), grant ELY-DEG SI/501198-01 is gratefully acknowledged. T.J. Schmidt thanks Innosuisse and the Swiss Competence Center for Energy Research (SCCER) Heat & Electricity Storage. The authors kindly acknowledge Oxford Instruments for providing the Andor camera, which was used to record the neutron images.

