
Data Processing and Analysis
Automatic Data Processing (adp)
Currently, automatic data processing (adp) provides a strategy based on diffraction screenshots and processing results for standard datasets and serial crystallography. The results of adp can be inspected in the Adp-tracker (see Data Processing Adp-tracker section below for details). In the case of a standard dataset, adp is split into two steps:
- the ‘fast step’ (called fast_xds), which is followed by
- the ‘complete step’ for full processing of all data (go.py/autoPROC)
In the case of serial data collection adp performs one round of fast XDS processing on each miniset (no full data processing). Fast_xds is a wrapper function, which utilizes the XDS program package. To maximize the speed of data processing of standard datasets, fast_xds is split into three consecutive runs. The angular range chosen for each fast_xds stage depends on the total angular range of the collected dataset.
| Angular range of full dataset | Angular range in fast_xds integration step |
|---|---|
| < 60 | full range |
| 60 < and < 180 | full range |
| 180 | 120 |
| >180 | 180 |
Whole data processing is performed with the in-house-developed go.py pipeline, which initially processes data with XDS in the space group P1 using all frames. In the next step, the space group is determined using POINTLESS, and data are reintegrated (if necessary) and rescaled in a new space group. In the last step, the data quality is assessed with phenix.xtriage and final mtz file(s) are prepared. Is also possible to perform full processing with autoPROC instead of go.py.
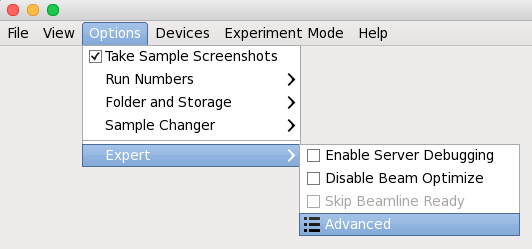
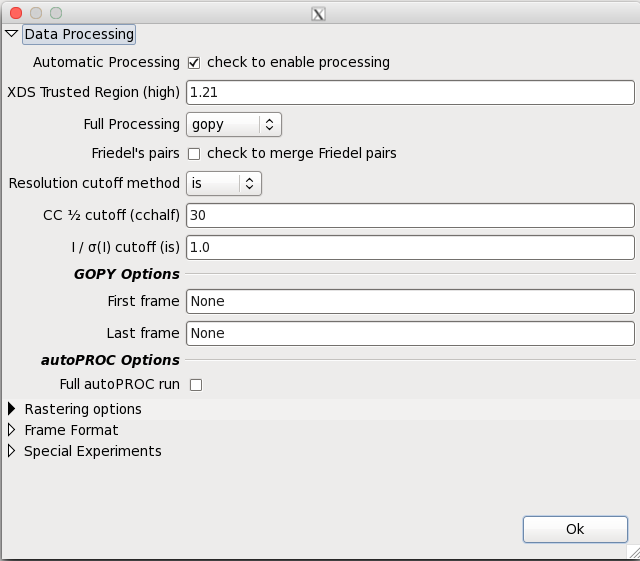
Adp accepts few parameters, which can be provided in the dedicated DA+ GUI window. Adp parameters window can be found in Options -> Expert -> Advanced -> Data processing.
During strategy calculation with adp diffraction images are indexed and a strategy is calculated with MOSFLM (Battye et al., 2011). In the case of data in HDF5 format, the initial step involves conversion to CBF data format with open-source eiger2cbf script. The resulting data files contain a CBF header with correct experimental metadata that allow indexing and strategy calculations to be performed with MOSFLM.
Adp results folder is located in the folder, where raw data is saved. In the case of standard dataset adp_dataPrefix_timeStamp contains three folders:
- fast_xds, which contains results of the fast processing
- gopy, which contains results of the full dataset processing with in-house go.py routine
- or
- autoproc, which contains results of the full dataset processing with autoPROC
- manual_xds - contains XDS.INP file with all experimental details (including full data range) for manual data processing
Automatic Data Merging (adm)
Automatic data merging (adm) performs automatic online merging of synchrotron serial crystallography minisets. Adm results are stored in the folder named adm_serial-xtal_dataPrefix, which contains subfolders called adm-numberOfDatasets. Adm internally counts all collected minisets for a given MergeID and performs merging (using sxdm merge utility written by Shibom Basu) at predefined and hardcoded intervals. The main goal of sxdm is to find subsets of minisets, which give best data statistics using different selection criteria.Data Processing Adp-tracker
Data processing Adp-tracker allows for real-time monitoring of results of the automatic data processing routines. To start data processing tracker on any beamline computer type in terminal: adp -p or on user console go to launcher (DA+ Launcher for Users) and from "User Applications" choose "Data Processing Tracker".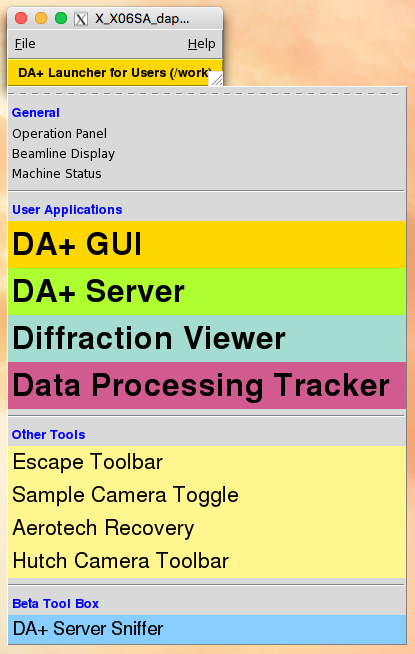
Data processing tracker has two modes for standard data collection and serial crystallography. The Mode Switch button in top-left corner of the application allows switching between these two modes.
The Adp-tracker automatically updates results of adp & adm (so it is not necessary to press refresh button in firefox). The view on on the standard datasets is presented below.
- Visual clue icons - under each dataset name there is set of icons representing state of each stage of processing of current dataset.
- Green thumb up - stage completed successfully
- Red thumbs down - stage failed, reason will be displayed in main window
- Round arrows - stage is being currently processed
- Clock - stage is pending in queue to be processed
- Green thumb up - stage completed successfully
- Navigation in Adp-Tracker
- Dataset Tab - switch to see list of collected datasets
- Strategy Tab - switch to see list of collected screenshots and respective results of strategy
- Datasets - each item is one collected dataset. Click to see details of processing
- Calendar - by default Adp-Tracker displays only datasets that were collected up to two days before. Should you require different date range, click there.
- Selection Button - allow to select datasets and perform Action on them, for instance printing to PDF
- Dataset Tab - switch to see list of collected datasets
- Printing Datasets to PDF
- Print selected Dataset to PDF - returns PDF with results formatted in tables
- Switch back to Normal Mode - exits Selection Mode of Adp-Tracker
- Print selected Dataset to PDF - returns PDF with results formatted in tables
The “Sx-View” is very similar to normal Data Collection display above. The new and additional interface details are described below.
- Minisets Tab - allows to see results for all the minisets collected. Note: for minisets there are only three stages of adp performed, hence only three status icons are displayed under each miniset name.
- MergeID Picker - all minisets that are collected with the same MargeId will be merged together. In the case multiple MergeID’s were used during data collection, they can be accessed and browsed through this button. When data collection starts with new MergeID Adp-tracker will display pop-up window asking to switch to this MergeID.
- To access Merge Data click on “Merge Sets Tab”
- The name of the Merge Sets reflects how many dataset were merged into one data set
- The Merge Tab displays plots for data analysis. Those plots are interactive.
- On line plots each series can be enabled/disabled by clicking on series label
- On Dendrogram plots, panning with mouse will zoom plot for more details.
- On line plots each series can be enabled/disabled by clicking on series label
Remote offline data processing
Recently, as part of the DaaS (Data Analysis as a Service) SUK project, which aims at providing user analysis services for data taken at the Paul Scherrer Insitute, a new computer cluster “Ra” has been implemented. It is an offline data processing cluster with 32 nodes Dual Xeon E5-2690v3 (2.60 GHz), 256 GB ram, Scientific Linux 7.0 with the latest MX software packages, which can be accessed via ssh or NoMachine protocols.For more information including how to access Ra cluster: https://www.psi.ch/photon-science-data-services/offline-computing-facility-for-sls-and-swissfel-data-analysis
Data processing with XDS
Data processing with denzo
- def.site for def.site file for PILATUS 6M detector
Scale and merge datasets with go2gether.com
Molecular replacement with go2mr.com
Other crystallographic software
autoproc, adxv, arcimboldo, arp/warp, buster, csds, ccp4, cns, coot, gpx2, hkl2map, imosflm, phenix, rosetta, sharp, shelxc-e, xds, xia2
Data backup
dmesg
and sudo mount /dev/sdb1 /media/disk1 Use rsyncdir script to automatically synchronize collected data with external hard disk. In a terminal type: rsyncdir ~/Data10/mySLSdata /media/MyDisk/